Are Your Fair & Festival Sponsorships Delivering Real ROI?
Sponsoring fairs and festivals is a big investment. But if you can’t measure success, how do you know it’s worth it?
Without clear benchmarks, sponsorship teams struggle to prove value, optimize spending, and justify budgets.
This Fair & Festival Sponsorship Benchmark Report gives you the data you need to:
- Compare your sponsorship performance to industry leaders.
- Justify your sponsorship budget with real data.
- Optimize future event investments for higher ROI.
Get the Right Report for Where You Are in the Journey
Not every sponsorship team needs the full playbook, yet. That’s why we’ve made it easy to start with a free sample, dive deeper with an executive summary, or go all-in with the full strategic report.
No matter where you are, this benchmark data helps you stop guessing and start making sponsorship decisions with confidence.
Choose the level of detail that fits your needs today and upgrade anytime.
| Free Download |
★ Recommended
Executive Summary |
Full Strategic Report | |
|---|---|---|---|
| OVERVIEW | |||
| ● Full Report Overview ? A high-level walkthrough of what’s included — from benchmarks to strategic frameworks — so you know exactly what you’re getting. |
✔ | ✔ | ✔ |
| ● Use Case Scenarios ? Real-world examples of how sponsorship teams use this data to justify spend, secure buy-in, and optimize results. |
✔ | ✔ | ✔ |
| ● Industry Benchmarks ? Access national performance benchmarks across spend, engagement, ROI, and targeting — segmented by event type and category. |
Select Data | Key Metrics | Detailed & Segmented |
| STRATEGIC INSIGHTS | |||
| ● Data-Driven Design ? Frameworks and examples for building campaigns around what actually works — based on the data. |
❌ | Summary | Detailed & Segmented |
| ● Consumer Targeting ? Event patron insights that show who engages and how to reach them at live events. |
❌ | Summary | Detailed & Segmented |
| ● Marketing Impact ? Understand how your campaigns is affected by brand awareness, and the anticipated impact on consumer advocacy and future purchase — with proven benchmarks. |
❌ | Summary | Detailed & Segmented |
| ● Budget Benchmarks ? Compare your spend against top brands across categories, event types, and market tiers. |
❌ | Summary | Detailed & Segmented |
| ● Campaign Value/ ROI ? See how your sponsorship returns compare across spend, engagement, and cost-per-interaction. Or project returns based on historical sponsorships. |
❌ | Summary | Detailed & Segmented |
| SUPPORT & DATA ACCESS | |||
| ● Analyst Support ? Get one-on-one guidance from a PortMA analyst to apply the insights directly to your sponsorship strategy. |
❌ | ❌ | ✔ |
| ● Raw Data Download ? Access the full de-identified dataset for custom analysis and internal reporting — ideal for analysts and data teams. |
❌ | ❌ | Add-on * |
|
|
$695
PURCHASE
$695 Future Credit Included**
|
$1,295
PURCHASE
$1,295 Future Credit Included**
|
Want the data behind the report? You can purchase the full raw survey dataset for an additional $2,605
Includes credit toward any future report or upgrade
Not quite ready to purchase?
Download the free sample report to preview the data and explore the benchmarks risk-free.
A Clear Plan for Proving Sponsorship Success
Step 1: Download the Report
Get instant access to high-level benchmarks and explore what’s possible with data-driven sponsorship planning.
Step 2: Choose Your Report
Select the Executive Summary or Full Report to unlock deeper insights, ROI modeling, and full campaign performance breakdowns. Every dollar you spend becomes credit toward future purchases. That means you can explore other industry reports, upgrade when ready, or access updates at no additional cost.
Step 3: Apply Insights with Expert Guidance
Your purchase of the full report includes up to 3 hours of direct one-on-one support with an account manager to help you put the data into action.
What’s Inside: The Sponsorship Benchmarks You Need
Most sponsorship teams guess at their impact. But you don’t have to. This report gives you hard numbers, including:
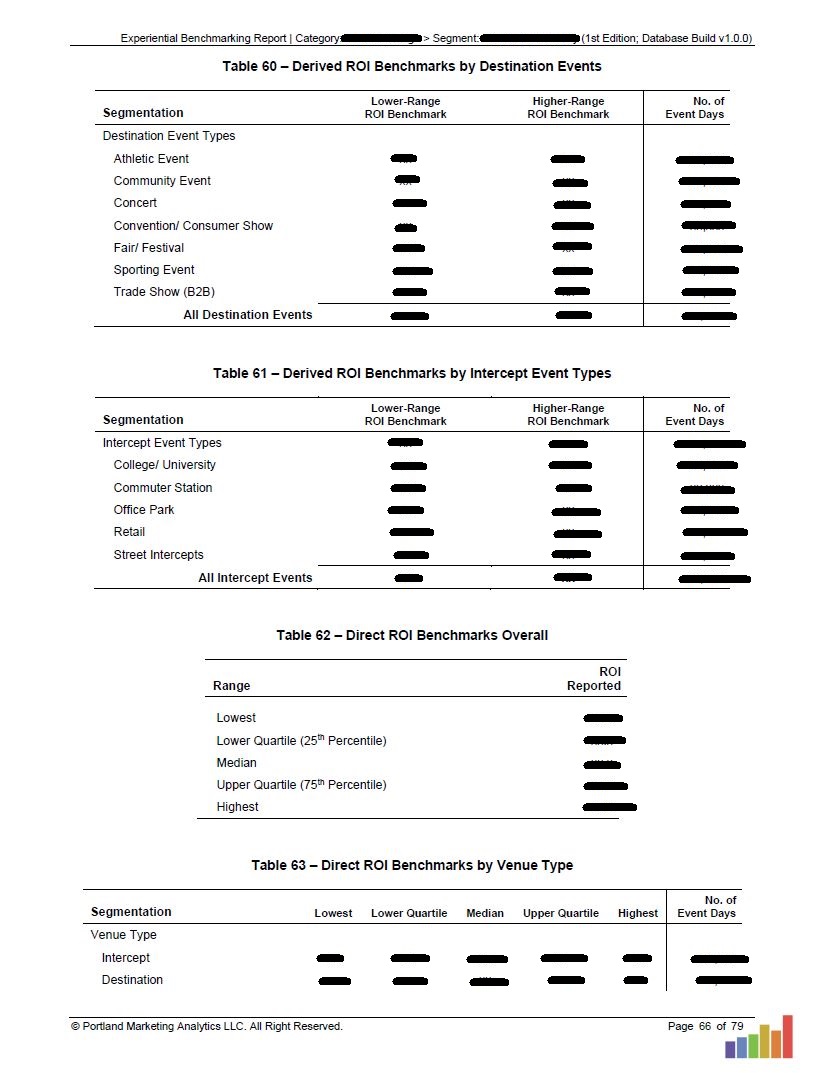
- ROI by venue and region
- Cost per interaction benchmarks
- Demographic targeting performance
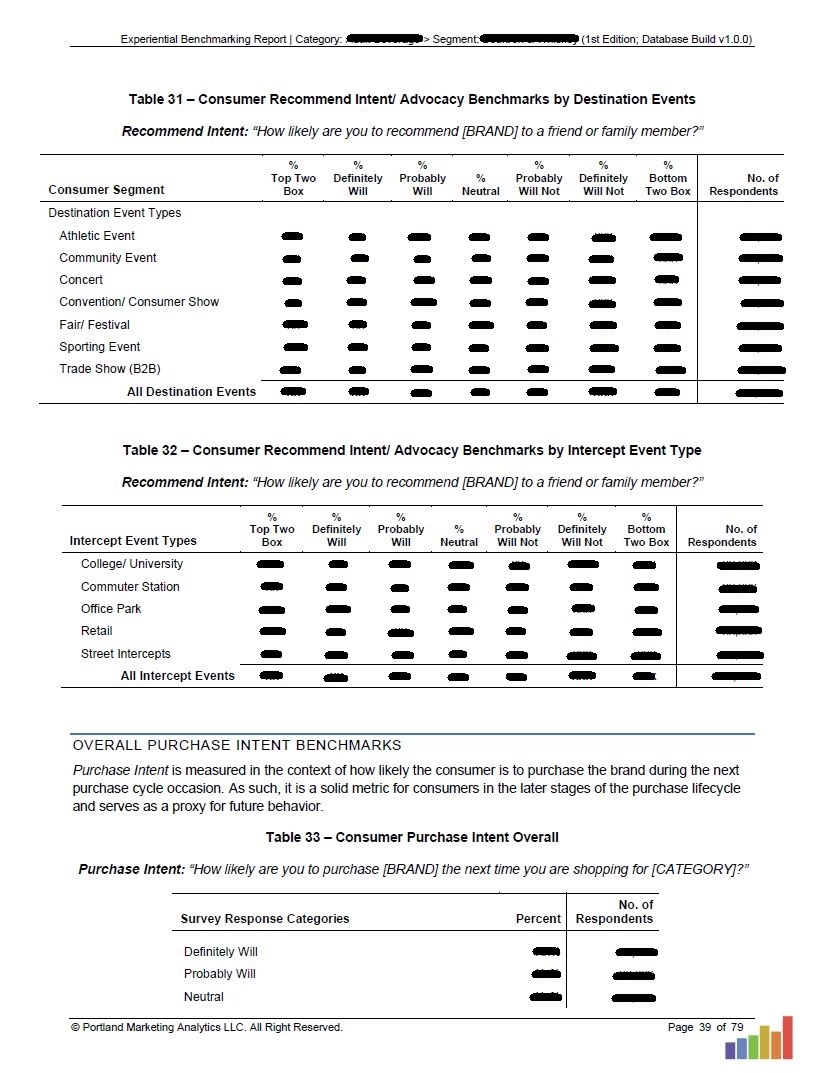
- Purchase intent and advocacy lift
- Engagement volume and efficiency by event type
Industry Data You Can’t Get Anywhere Else:
- 680 Event Days – Across top fairs and festivals.
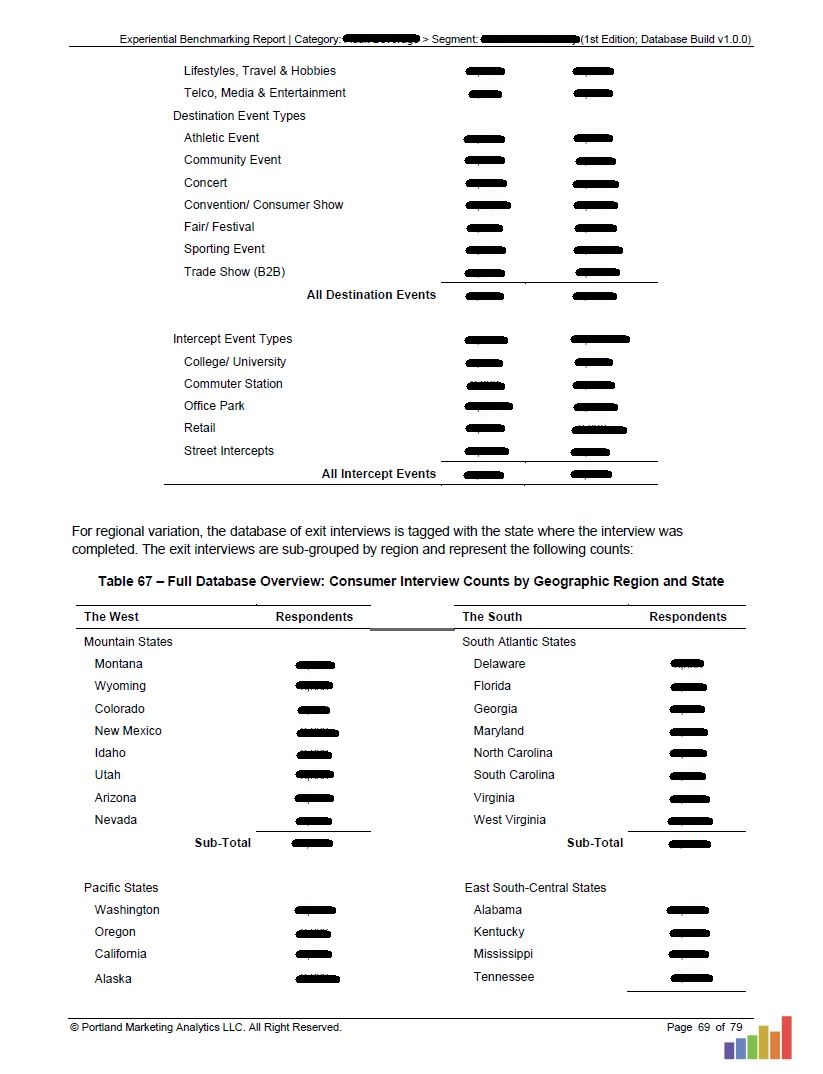
- 71,168 Consumer Exit Interviews – Real audience insights.
- 2.8M Consumer Interactions – See how engagement compares.
- 4.08M Product Samples Distributed – Benchmark sampling effectiveness.
- $5.59M in Sponsorship Spend Analyzed – Compare your event budgets.
- 23.4M Estimated Event Attendance – Understand your potential reach.
Use this report to make smarter, data-backed sponsorship decisions. The full, industry-exclusive, strategic report is available for $1,295, less than the cost of a single event sponsorship mistake.
Start Using Industry Benchmarks TodayThis Report Helps You Avoid Common Sponsorship Pitfalls
Many brands waste sponsorship dollars because they:
Invest in the wrong events – Without data, they choose sponsorships that don’t reach the right audience.
Struggle to prove value to stakeholders – Without clear benchmarks, budgets shrink and sponsorships get cut.
Fail to optimize activations – They don’t track key engagement metrics, leaving money on the table.
The Fair & Festival Sponsorship Benchmark Report helps you avoid these mistakes and make sponsorship decisions with confidence.
Your Executive Summary Pays for Itself
Buy Once. Save Later. Upgrade Anytime.
When you purchase the Executive Summary, you’ll receive an exclusive coupon code that can be applied toward any future purchase — including:
- A second Executive Summary from a different industry (essentially a 2-for-1)
- A future edition of this report, when it’s updated (usually every 1–2 years)
- The Full Report, making the upgrade cost even less than what you’ve already paid
This lets you get started with zero pressure. If and when you’re ready for more depth, you’ve already locked in your discount.
Buy with confidence. Your investment carries forward.
What Other Sponsorship Teams are Saying

“PortMA understands how to analyze the true value of experiential marketing.”
Matt Sincaglia, VP, Strategy & Analytics at RedPeg Marketing

“Since our agency opened for business back in 2008, we’ve understood how important it is to measure the effectiveness of our programs – that’s why we’ve turned to PortMA.”
Jeff Snyder, Chief Inspiration Officer at Inspira Marketing Group

“Great communication, always prompt with timeliness, super helpful + knowledgeable, information/data provided is clear and concise, and the team is always willing to walk through it with you!“
Alexandra Eischen, Connections Planning Specialist at fairlife, LLC
You Have a Choice: Keep Guessing or Start Optimizing
Option 1: Keep making sponsorship decisions without data and risk wasting budget.
Option 2: Get industry benchmarks, apply proven insights, and make sponsorships a powerful revenue driver.
- Benchmark your performance.
- Justify your sponsorship budget.
- Optimize future events for better results.
Most brands spend $50,000+ on event sponsorships each year. For just $695, you can make sure every dollar is spent effectively. How much would it cost to keep guessing? Invest in data that drives results.
Download the Fair & Festival Sponsorship Benchmark Report NowFrequently Asked Questions
Q: What’s the difference between the Executive Summary and Full Report?
A: The Executive Summary includes high-level benchmarks and insights for the fairs and festivals category as a whole. It's ideal for planning and stakeholder conversations.
The Full Report goes deeper with segmented data by industry, region, age or generation, gender, and parental status. It also includes ROI modeling tools and 3 hours of expert support to help you apply the insights directly to your campaigns.
Q: Can I upgrade later if I start with the Executive Summary?
A: Yes! When you buy the Executive Summary, you’ll receive a $695 credit to apply to any future purchase — including the Full Report. That means you only pay the difference if you decide to upgrade.
Q: If I buy the Full Report or Raw Data, can I use that as credit later?
A: Yes. The full price of your purchase becomes a credit for future reports, industries, or upgrades. If you buy the Full Report ($1,295), you get a $1,295 coupon. If you include the Raw Data Add-On ($2,605), your total credit increases to $3,900. Your investment carries forward.
Q: Can I use the credit for other reports, too?
A: Absolutely. Your $695, $1,295, or $3,900 credit can also be applied toward another report in a different industry or used when the report is updated in the future (usually every 1–2 years). Your investment rolls forward.
Q: How current is the data in this report?
A: The report is based on over 1.27 million consumer interactions across 680+ event days. Benchmarks are updated every 12 to 24 months to ensure ongoing relevance. If you're purchasing close to an update, you'll be notified when the next edition is released and you can use your credit toward it.
Q: What types of organizations use this data?
A: This report is trusted by experiential agencies, brand managers, and sponsorship teams across CPG, beverage, finance, and more. It’s designed for professionals who need to justify spend, win buy-in, and optimize event ROI.
Q: What if I need help interpreting the data?
A: If you purchase the Full Report, you’ll receive up to 3 hours of one-on-one support with a PortMA analyst. We’ll help you build models, answer questions, or tailor the data to your specific strategy. Executive Summary purchasers can also contact us to schedule additional support as needed.