
Overview of Available Benchmarks
PortMA’s benchmarking database of experiential marketing performance is derived from several types of market research data: 1) Event Staff Recap Reporting and 2) Consumer Exit Surveys.
We bring these types of market research together into a centralized data warehouse to provide you with insights and reporting you can use to differentiate your own proposals and better recap your experiential marketing programs.
Campaign MetaData
Event Staff Recap Benchmark Metrics
- Activation Year
- Number of Brand Variants Promoted Onsite
- Engagement/Sampling Type
- Total Campaign Budget
- Average Retail Price per SKU for the Product/ Servicing being Promoted
- Annual Customer Value
- Event Day Count
- Total Venue Attendance
- Activation Hours
- Staffing Hours
- Onsite Sales/ Hand Sales Count
- Total Interactions
- Total Samples
- Total Consumers Sampled
- New Customer Estimate from ROI Modeling (Conversion)
- Campaign Return-on-Investment (ROI)
- PortMA Industry Classifications (4 Levels)
These data points are used to develop the following marketing efficiency measures for benchmarking:
- Average Engagements per Hour
- Average Engagements per Event Day
- Average Cost per Engagement
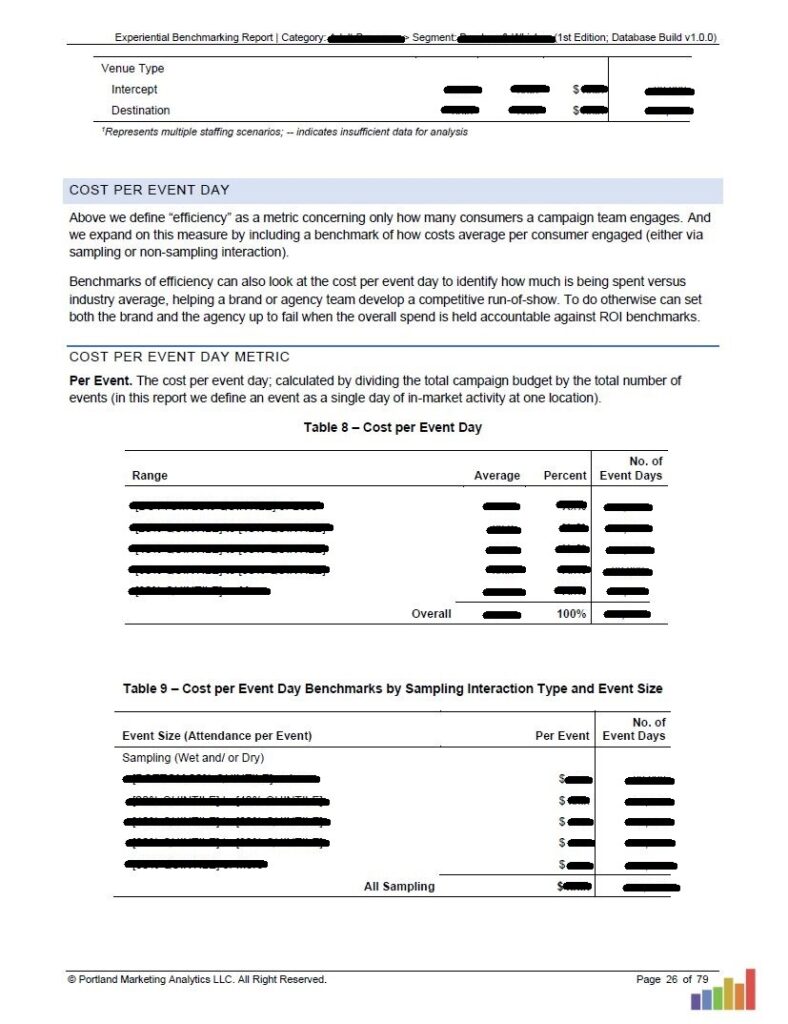
- Cost per Event Day
Each of these MetaData benchmarks is presented in every report as an overall measure and then segmented by quintile, sampling vs non-sampling events, and average event size.
Click to View
Click to View
In our Industry Reports (e.g., Wine, Foods, Personal Care, etc.) we segment MetaData benchmarks by Intercept Events (e.g., College/ University, Office Park, Retail, etc.) and Destination Events (e.g., Sporting Event, Fair/ Festival, Community Event, etc.).
The MetaData benchmarks in our Venue Reports (e.g., On-Premise, Fairs/ Festivals, Retail, etc.) are segmented by industry classification (e.g., CPG, Durable Goods, etc.)
Consumer Data
Consumer Exit Interviews Collected Onsite
- Interview Date (or Year)
- Interview Time
- Pre- (“Control”) or Post-Engagement Interview (“Test”)
- Gender
- Year of Birth
- Presence of Kids in the Household
- Brand Awareness
- Purchase Intent
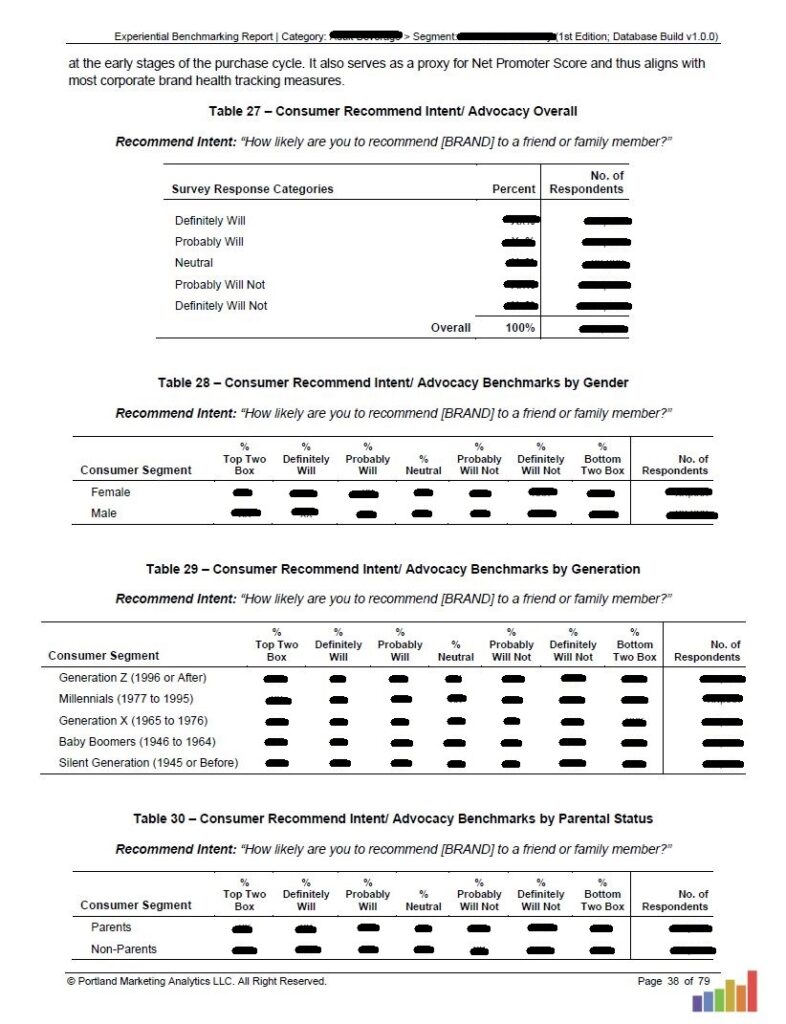
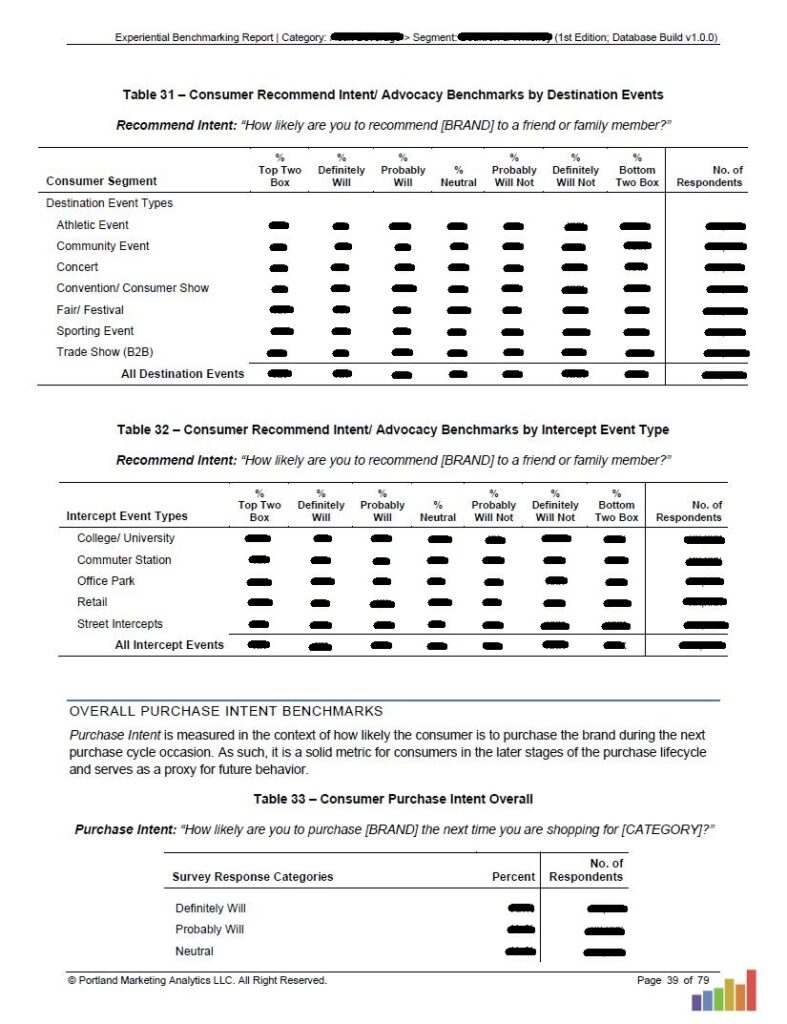
- Recommend Intent/ Advocacy
- Market (three tiers)
- Event Type (two tiers)
These data points are used to develop the following consumer targeting benchmarks:
- Gender Prevalence by Venue Type or Industry Category
- Age/ Generation Prevalence by Venue Type or Industry Category
- Parental Status by Venue Type or Industry Category
- Brand Awareness by Gender, Generation, and Parental Status
- Brand Awareness by Venue Type or Industry Category
In addition, the following impact benchmarks are provided in every report:
- Purchase Intent by Venue Type or Industry Category
- Recommend Intent/ Advocacy by Venue Type or Industry Category
- Loyalty Marketing: Current Brand Customer Purchase Intent
- Win-Back Marketing: Lapsed Brand Customer Purchase Intent
- Conversion Marketing: Impact Benchmarks for Early-Stage Purchase Cycle Consumers
Click to View
Click to View
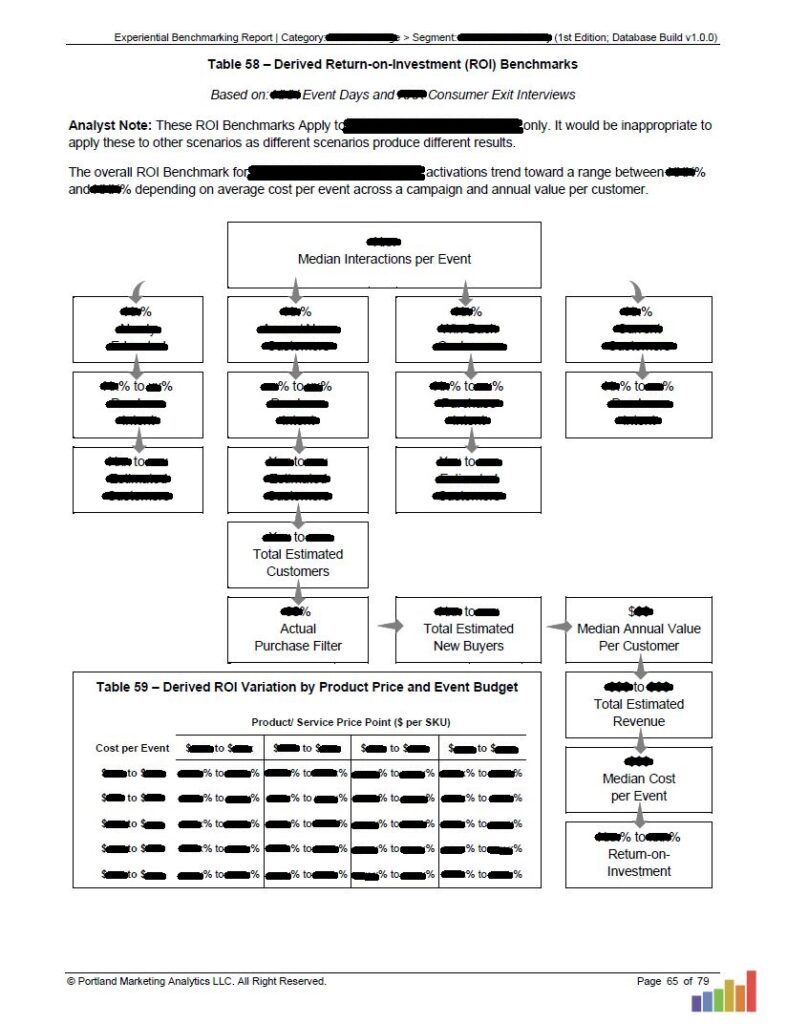
And for campaign value benchmarks, the following Return-on-Investment (ROI) related metrics are benchmarked and included in every report:
- Median Interactions per Event
- Total Estimated New Buyers per Event Day (Range)
- Median Annual Value per Customer
- Total Estimated Revenue Generated per Event Day (Range)
- Median Cost per Event Day
- Derived Return-on Investment Range
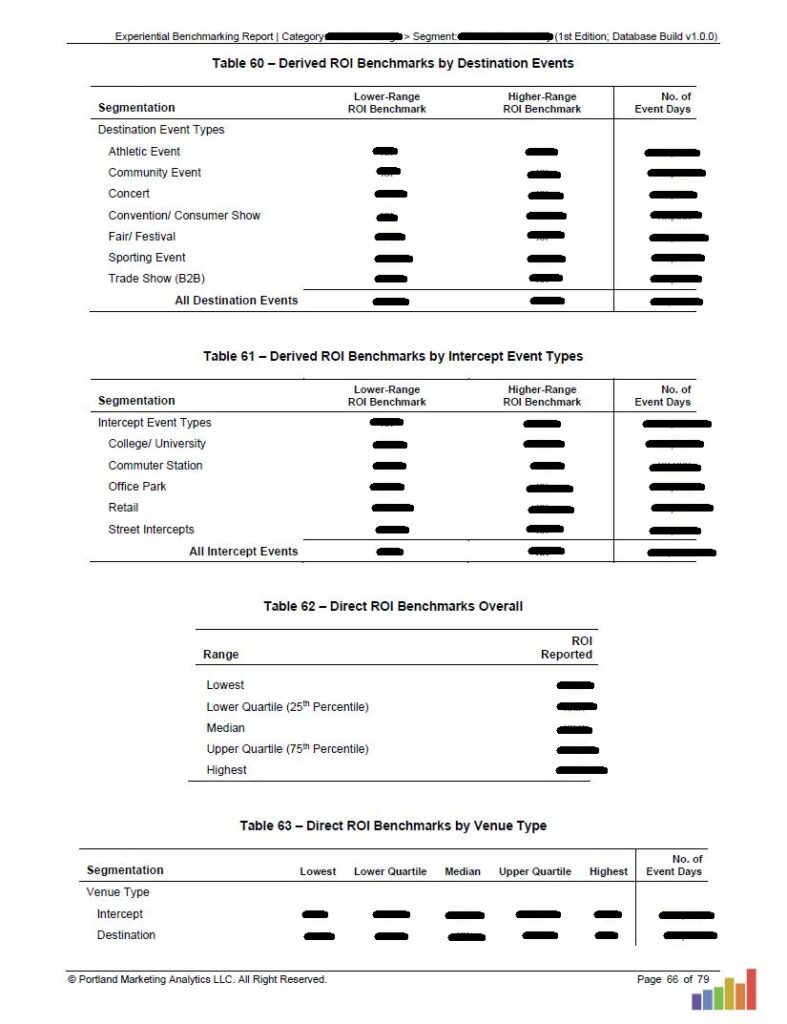
- Derived ROI Range by Cost per Event Day and Product Price Point
- Derived ROI Range by Venue or Industry Category
- Direct ROI Range by Venue or Industry Category
Click to View
Click to View
Each of these Consumer Benchmarks is presented in every report as overall frequencies and Average (age) measures.
In our Industry Reports (e.g., Wine, Foods, Personal Care, etc.), we segment Consumer Benchmarks by Event Type Category (i.e., Intercept vs Destination Events) and Event Type Sub-Category (College/ University, Office Park, Sporting Event, Fair/ Festival, etc.).
The Consumer Benchmarks in our Venue Reports (e.g., On-Premise, Fairs/ Festivals, Retail, etc.) are segmented by industry classification (e.g., CPG, Durable Goods, etc.)
Age is presented as an average overall and by generation. “Generations” are defined by the following Year-of-Birth breaks:
- Generation Z: Born 1996 or after
- Millennials: Born between 1977 and 1995
- Generation X: Born between 1965 and 1976
- Baby Boomers: Born between 1946 and 1964
- Silent Generation: Born between 1945 and before
We classify Venues into the following categories:
Destination Events
Athletic Events
Community Events
Concerts
Conventions/ Consumer Show
Fairs/ Festivals
Sporting Events
Trade Shows (B2B)
Intercept Events
College/ University
Commuter Station
Office Park
Retail
Street Intercepts
Lifestyle Events
On-Premise
Off-Premise
Interested in learning more about the various types of market research we offer?
Contact the team at PortMA today!