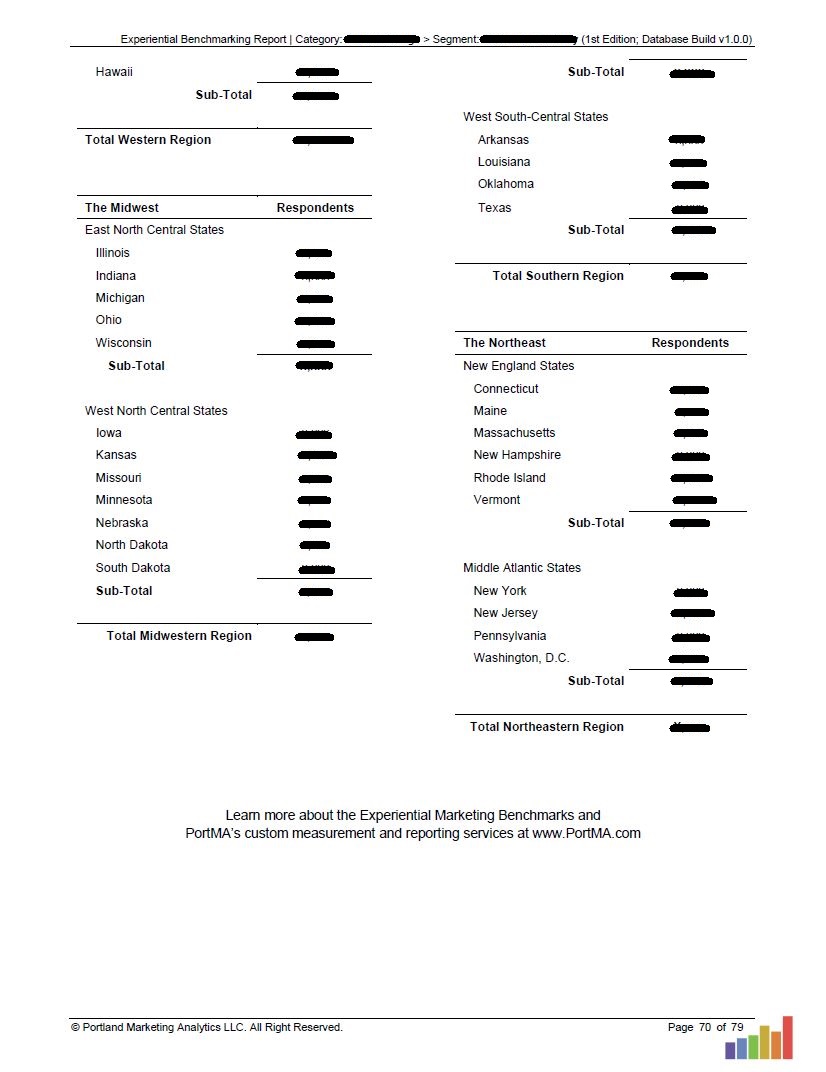
Data for the analysis in this report were collected via field staff recap reports after 2,121 experiential event days on- and off-premise. The field staff event recap data from these activations were combined with 12,084 consumer exit interviews, collected onsite, and formed the basis for this analysis.
Liqueur Sampling: Experiential Marketing Benchmarks
1st Edition | Region: United States
2,121 Event Days | 12,084 Consumer Interviews
Executive Summary (1 Page), Full Report (70 Pages), PowerPoint (62 Slides)
$395 – Single User License (PDFs, PowerPoint, & Analyst Support)
This report benchmarks experiential marketing activations where Liqueur brands were sampled at On- and Off-Premise activations where a total of 96,907 samples were distributed.
- Event Days: 2,121 Liqueur Sampling Event Days; On- and Off-Premise
- Consumer Interviews: A Total of 12,084 Post-Engagement Consumer Interviews Completed Onsite
- Interactions: 209,288 Total Liqueur Event Consumer Interactions
- Samples: 96,907 Liqueur Samples Distributed
- Campaign Budgets: Over $1,558,716 in Liqueur Sampling Marketing Spend
- Attendance: 499,364 Recorded Attendance On- and Off-Premise
At the time of this publication, PortMA’s Experiential Benchmarking database (across all industry segments) contains over $87.4 million (USD) spent on experiential brand marketing across 74,990 event days and 17,706,070 consumer interactions.
Applying This Report to Your Business
See how great Experiential Marketers measure the ROI of their events with these use case videos. Gain access to the suite of brief videos below by submitting your email address.
In these videos, we use actual data from experiential campaigns to describe the status update and recapping techniques used by leading agencies and brands.
Business Use Case Scenarios
Applying This Report To Your Business
Use case scenarios (and how to apply them to your business) are detailed in each report. Below are some of the common applications of experiential ROI benchmarks:
-
- Designing a Winning Marketing Campaign
- Selling Your Experiential Campaign to Stakeholders
- Negotiate Better Venue and Sponsorship Agreements
- Validating a Proposal’s Performance Promise and Budget
- Managing Campaign Performance
Use Case Details
- Designing a Winning Marketing Campaign
The best predictor of the future is the past. And when you can plan based on a well-organized set of data that benchmarks this history, you can create a campaign that will get it right more often from the start. You’re moving your marketing downriver faster because you can use benchmarks to identify the venues that have your consumer target and strike a stronger balance between “event size” and “event frequency”. - Selling Your Experiential Campaign to Stakeholders
We’re all always selling. It doesn’t matter if you’re a Brand Manager talking to your VP or if you’re an Agency Director talking to your Brand Client. You need to demonstrate that your reasoning is sound, and your plan is positioned to be a success. Experiential marketing benchmarks allow you to differentiate yourself from the external and internal competition and demonstrate the value before the money is spent. - Negotiate Better Venue and Sponsorship Agreements
The right benchmarks will give you a point of reference when speaking with venue managers or when developing sponsorship agreements. You’ll be in a stronger negotiating position with data on your side because you can validate venue manager and producer performance commitments and choose the best sponsorship package. - Validating a Proposal’s Performance Promise and Budget
A solid benchmarking resource will allow you to validate an outside agency or vendor’s plan. We recommend that you consult the right benchmarking tables in your report anytime you’re evaluating an experiential activation strategy; validate agency performance commitments and evaluate a campaign’s budget before committing. - Managing Campaign Performance
When you have performance benchmarks from dozens of experiential programs you know what to expect. The proper use and application of experiential benchmarks will allow you to establish the right Key Performance Indicators (KPIs) to evaluate campaign performance during execution and recap your program when it is complete.
Report Package Details
What Do I Receive When I Purchase a Report?
Each report purchase includes three documents and support from our research team to ensure you get the solution you need.
- Experiential Marketing Benchmarks Report (Fully Indexed PDF)
First, you’ll receive a comprehensive PDF that provides a full background on the data collection methodology and the related experiential marketing strategy. This includes the data points collected, how, and why. This background provides a full outline of PortMA’s proprietary return-on-investment model. The report benchmarks define the reach, impact, and ROI trends across the industry and multiple venue types. These metrics are detailed in tables within this broader context of theory and application. - Data Tables Deck (PowerPoint Document)
Second, we summarize the experiential marketing strategy and related data with the data tables on individual slides in a PowerPoint document. This document is provided to easily pick and choose the slides that are most relevant to individual efforts. These slides can be repurposed in your own Client recap reports, RFP responses, and individual presentations. - A 1-Page Executive Summary (PDF)
Third, a top-line summary of the experiential marketing report is presented in a one-page executive summary using PortMA’s proprietary “Scorecard Reporting” methodology. This document serves as a quick reference on the key data points and industry ROI segments. The report is designed for easy reading and distribution to internal management. It also serves as a quick reference guide.
A seasoned Experiential Marketing Analyst will be assigned to your account for on-call support by email or phone.

You are encouraged to call on your Account Manager for any of the following. You are provided with one hour of on-call support for the 12 months following your purchase. Additional time can be purchased if/ as needed.
- One-on-One or Team Training
- Sales Support/ RFP Response Assistance
- Survey/ Data Collection Architecture Design
- Data Dashboard Consulting/ Wire Frame Development
- Data Analysis Assistance or Completion
- Report Development Assistance or Completion
- Client Briefing Preparation, Attendance, or Meeting Leadership
Your account manager would be happy to provide you with any ad-hoc analyses you might need based on the raw data behind the report you purchased.