Estimating and Using Experiential Marketing ROI with Benchmarks
How to Use Benchmarks and Actionable Experiential Marketing ROI to Develop a Winning Campaign
![]() Video Length: 6 minutes 31 seconds
Video Length: 6 minutes 31 seconds
Value in marketing can take many different forms. But at PortMA, we like to think in terms of hard currency. Dollars and cents. This is why we love Return-on-Investment (or ROI) modeling. ROI modeling is a fantastic overall index measure of how well a campaign balances reach volume, reach quality, and impact with the dollars or budget available.
Table of contents
- Estimating and Using Experiential Marketing ROI with Benchmarks
- Calculate and Value Five Types of Experiential Impressions
- Frequently Asked Questions
- Video Transcripts – Actionable Experiential Marketing ROI
- 01:07 Typical Return-on-Investment (ROI) for a Wine Sampling Event
- 01:23 Wine Sampling Benchmarks – Median Engagements per Event Day
- 02:13 Wine Sampling Benchmarks – New Customer Estimates
- 02:48 Wine Sampling Benchmarks – Revenue per Event Day and ROI
- 03:36 Customizing a Predictive Experiential Marketing ROI Model
- 04:23 Testing Different ROI Scenarios for Planning or Sales Support
- 05:31 Determining if Your ROI Result is “Good”
- Additional Reading

Calculate and Value Five Types of Experiential Impressions
This tool has been designed to assist with the value calculation for five impression types: Mobile Impressions, Event Impressions, Viral Word-of-Mouth, Organic Media, and Paid Media.
Frequently Asked Questions
When reviewing this data for the Wine Industry, we see a typical ROI range between 67 and 117%.
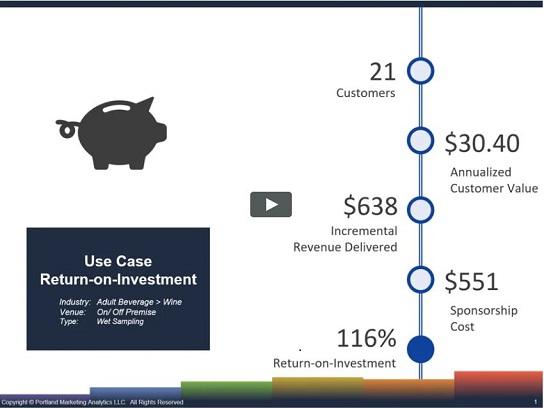
The modeling for a typical day of activation starts with the median number of engagements, which we see here is 53 per day for the wine category.
The typical day of wine sampling likely generates between 12 and 21 new customers.
Hard going. No one said Experiential Marketing was easy. What we know from the wine sampling benchmarks is that most activations are barely breaking even. When engaging an average of 53 consumers per activation to market a product valued at $30 per year with a budget of $551 per day, most ROI’s are negative.
Video Transcripts – Actionable Experiential Marketing ROI
Estimated reading time: 9 minutes
Value in marketing can take many different forms. But at PortMA, we like to think in terms of hard currency. Dollars and cents. This is why we love Return-on-Investment (or ROI) modeling. ROI modeling is a fantastic overall index measure of how well a campaign balances reach volume, reach quality, and impact with the dollars or budget available. And when modeled correctly with the key components benchmarked over tens of thousands of activations, you end up with an unrivaled tool to determine feasibility and establish incredibly robust key performance indicators or KPIs.
Every one of PortMA’s syndicated reports and every Experiential BI Dashboard deployment has detailed ROI benchmarks so that you can do exactly that: evaluate the feasibility, establish real economic KPIs, and evaluate or compare success. This is a database that exists nowhere else in the industry today.
01:07 Typical Return-on-Investment (ROI) for a Wine Sampling Event
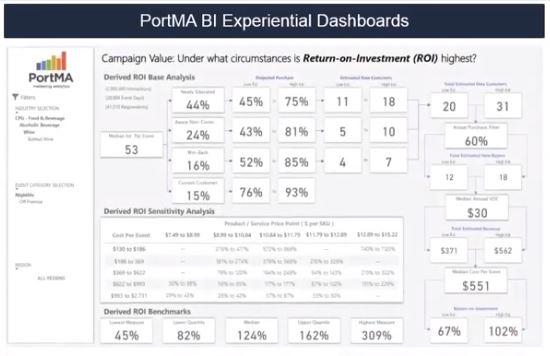
Let’s dive into the details a bit so we can walk through PortMA’s ROI model. When reviewing this data for the Wine Industry, we see a typical ROI range between 67 and 117%. It appears that there is some risk with wine activations on average. Less than 100% puts us in the negative.
01:23 Wine Sampling Benchmarks – Median Engagements per Event Day
The modeling for a typical day of activation starts with the median number of engagements, which we see here is 53 per day for the wine category. When evaluating the brand awareness (and thus the degree of marketing challenge), we see 44% had never heard of the brand before their activation experience. Note, we see 24% were aware but had never bought, 16% bought in the past, and 15% were current customers, but we’re just going to focus on the first row for now.
We want to look at these newly educated consumers and evaluate the range of their purchase likelihood through a low-end and high-end estimate. Here we see a purchase range of 45 to 75%. We can then multiply this all the way through median engagements, awareness level, and purchase estimate to derive a low and high-end estimate of new customers, for just the Newly Educated group of customers in our example here, that’s between 11 and 18 people.
02:13 Wine Sampling Benchmarks – New Customer Estimates
And when we do this across all awareness levels (newly educated, aware/ non-customer, past customer, and customer), we get a total low-end and high-end estimated customer count. So at this point, we can estimate that the typical day of activity for a day of wine activation generates somewhere between 20 and 35 possible customers.
But people don’t always do what they say they’re going to do. And so we need to pass them through an “estimated purchase” filter, which, for the example here, we’re using 60%. Passing the new customer count through this filter shows us that the typical day of wine sampling likely generates between 12 and 21 new customers.
02:48 Wine Sampling Benchmarks – Revenue per Event Day and ROI
So what’s this worth to the brand? Well, overall, we have an annualized value per customer (also benchmarked in PortMA’s database) of $30.40 each. Multiplying these new customer counts through the annualized value per customer yields a revenue range between $371 and $643 per activation day. Dividing this by the median cost per event (also benchmarked in PortMA’s database) results in the Return-on-Investment range of 67 to 117%.
Hard going. No one said Experiential Marketing was easy. What we know from the wine sampling benchmarks is that most activations are barely breaking even. When engaging an average of 53 consumers per activation to market a product valued at $30 per year with a budget of $551 per day, most ROI’s are negative.
03:36 Customizing a Predictive Experiential Marketing ROI Model
But maybe your plans are different than what is typical for the industry. Are you different enough to overcome these risks? Let’s say the brand team you’re serving is a bit on the conservative side and believes the actual purchase filter should be 45%, not 60%. And maybe the brand you’re working on sells for a little less. The Annual customer value is closer to $27 than 30. But the $551 per event day feels a bit generous, and you know you can do better with some volume. Your proposal has you at $500 per day on average.

Is this enough? How many more people do you have to engage per day to get the low-end estimated ROI above 100%?
You consult your Experiential BI dashboards and use the simulation tools to see that so long as you get your average up over 110 consumers sampled per day, you’ll see an ROI comfortably in the positive range.
04:23 Testing Different ROI Scenarios for Planning or Sales Support
But sometimes, you don’t need to run simulations around ROI modeling. You have a product and an idea and need to know, “How much can I spend per day and still have a chance at a positive Return-on-Investment?” We’ve done that work for you. Every report and Experiential BI Dashboard deployment has a set of targeted ROI simulations pre-calculated based on different product price points and activation budgets. We organize both “cost per event” and “product price” for the category into statistical groupings so you can find where you’re program falls and evaluate the expected ROI.
Here we see that wine brands that sell for less than $9 promoted at events that are spending over $622 per day are not delivering a positive ROI. And in the 9 to $11 range, you should be spending less than $400 per event day if you want to post a positive ROI. But as you move above $11 per bottle, there are several examples of different spend levels and strong returns for the brand.

You’ll see some dashes here and there. We only run the simulations when there is precedence. If there is no historical precedence for a particular product price point and budget pairing, we avoid wasting your time with the impossible.
05:31 Determining if Your ROI Result is “Good”
Finally, maybe your program is complete. Sometimes you want to know what other brand teams have reported. You want to answer the question, “Is my ROI of 160% good? How does it compare?” And you’re going to find that data in every PortMA syndicated report and each Experiential BI Dashboard deployment. We’ve benchmarked actionable experiential marketing ROI from hundreds of campaigns and organized them into statistical groupings so you can see what is average, what is low, and what is high.
So the answer is “yes!” You’re ROI of 160% is looking above average. Well done! Modeling return-on-investment is complicated, but it doesn’t have to be hard. PortMA details both the methodology and the benchmarks in all of our reports and dashboards. We provide you with one-of-a-kind modeling tools and a clear roadmap to communicate the value of your experiential marketing campaigns.