Experiential Marketing Engagement and Sampling Performance Benchmarks
Field Staff Benchmarks and Sampling Performance Benchmarks for Performance Evaluation and Management Action
![]() Video Length: 3 minutes 34 seconds
Video Length: 3 minutes 34 seconds
In this Use Case scenario, we’re going to look at how to evaluate your sampling rates in an actionable manner using sampling performance benchmarks. This is actual data from a wine sampling campaign presented in a typical manner with averages by market.
Table of contents

Calculate and Value Five Types of Experiential Impressions
This tool has been designed to assist with the value calculation for five impression types: Mobile Impressions, Event Impressions, Viral Word-of-Mouth, Organic Media, and Paid Media.
Frequently Asked Questions
When you segment your data by actionable groupings (e.g., market, venue type, etc.) you can look at the overall average performance and then compare that to the average performance by segment. Those areas that are above the average likely represent best practices and those below the average are where you should put your management’s attention.
In our hypothetical example here, we see that for the Wine Industry, field teams performing below average were doing less than 32 per day, the average was 32 to 53 per day, and above-average was over 52 per day.
In an analysis by PortMA of over 25,000 Experiential Marketing Wine Sampling activations it was found that the typical activation day distributed 56.9 samples and sold 10.2 bottles delivering a sample to sales ration of roughly 17.9%.
Video Transcripts – Sampling Performance Benchmarks
Estimated reading time: 5 minutes
In this Use Case scenario, we’re going to look at how to evaluate your sampling rates in an actionable manner. This is actual data from a wine sampling campaign presented in a typical manner with averages by market.
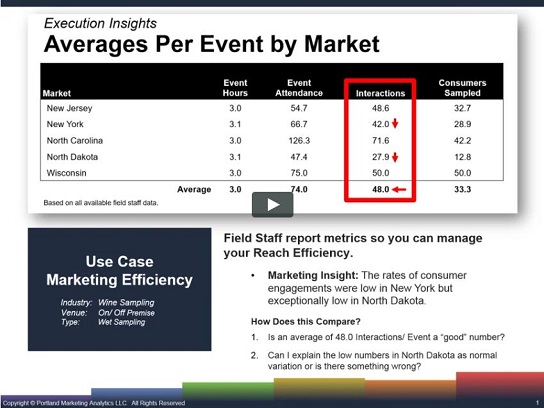
Above all, let’s focus our attention on the average interactions per market as this is a metric toward the top of the marketing funnel. Here we see that the rates of consumer engagements were low in New York but exceptionally low in North Dakota.
00:40 How To Determine if Sampling Rates are High or Low
We know they’re low because we can see that they are indexing below our overall average. Right away, a few key questions arise: is an average of 48 per event a “good” number? And can I explain the low numbers in North Dakota or even New York for that matter as a normal variation, or is there something wrong?
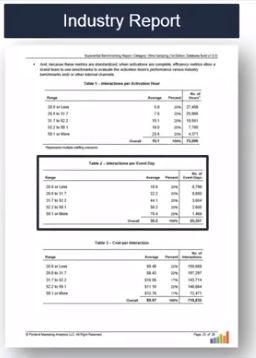
Moreover, this is where PortMA’s Industry Reports and Experiential BI Benchmarking dashboards come in to serve as your point of reference. Inside both the PDF reports and the online experiential dashboards, you’ll find average interactions per day by industry category or venue classification.
01:18 Typical Wine Sampling Activation Performance
In our example here, we see that for the Wine Industry, field teams performing below average were doing less than 32 per day, the average was 32 to 53 per day, and above-average was over 52 per day.
Based on over 25,000 days of sampling, we see the overall average was roughly 30 per day, so to start, “yes,” we can say our wine program average of 48 per day looks pretty good. But what about our lower-than-average numbers in NY and South Dakota? Well, NY looks fine. With a middle-range across our 25,000 strong benchmarks of 32 to 52, NY’s 42.0 fits nicely in the middle.
However, the same is not the case for North Dakota. At only 28 engagements per day, we’re seeing that North Dakota is below average and might be worth looking into. But, what’s going in North Dakota? Our benchmarks are telling us to take a closer look. Further, let’s extend our analysis out a bit to include the average samples distributed per day and the average bottle sold.
02:25 Analyzing Sampling to Sales Conversion Ratios in Experiential Marketing
When we look at North Dakota’s interactions to sample ratio, we see that they’re sampling roughly 46% of the consumers they engage. That’s a little low when the overall for the program was 69%. And likewise, they’re averaging 2.5 samples per consumer which are a little high compared to the 1.7 for the program overall.
But this additional sampling isn’t translating into the incremental conversation as they’re averaging 11%, while the program as a whole sees an 18% conversion of samples to sales.
But their average attendance is low. That now becomes a bit more obvious. It looks like they’re making up for it by oversampling. So the idea to do this deep dive into North Dakota when there were probably a dozen other markets you could have focused on came because your benchmark told you there were underperforming.