Experiential Marketing Campaign Budgeting Benchmarks
Experiential Marketing Budgeting Benchmarks for a Competitive Advantage and Fair Pricing
![]() Video Length: 3 minutes 55 seconds
Video Length: 3 minutes 55 seconds
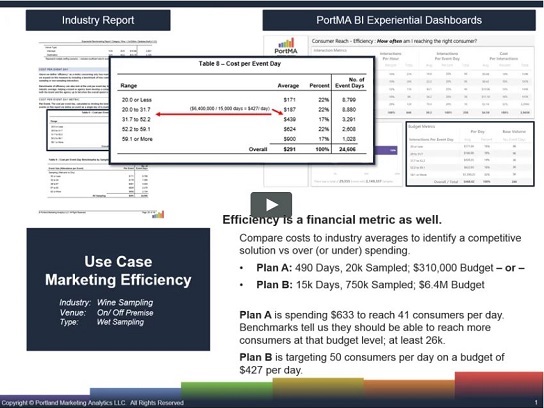
Marketing efficiency is a measure of performance, yes. But efficiency is a financial metric as well. In this use case, we’ll see how having the right financial benchmarks in place allows you to compare your costs to industry averages. This shows sellers how competitive their campaign is while informing buyers about over or under-priced campaigns.
Table of contents

Calculate and Value Five Types of Experiential Impressions
This tool has been designed to assist with the value calculation for five impression types: Mobile Impressions, Event Impressions, Viral Word-of-Mouth, Organic Media, and Paid Media.
Frequently Asked Questions
At PortMA, we benchmark experiential campaign budgets in terms of cost per activation day based on different levels of sampling activity/ expectations. This allows agency sales staff and brand buyers to compare the total volume of activation and program commitments to historical budget averages.
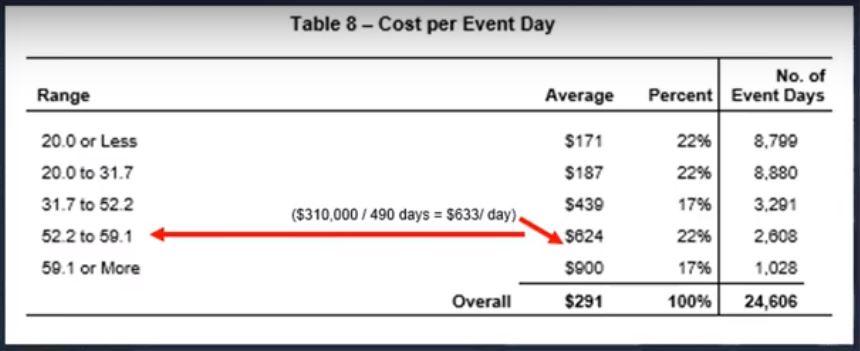
Over the course of 24,606 experiential wine sampling event days, the average cost per event day was $291 with a median of $439, bottom-end range (1st quintile) of $171 and the upper-end range (5th quintile) of $900.
Video Transcripts – Experiential Marketing Budgeting
Estimated reading time: 6 minutes
Marketing efficiency is a measure of performance, yes. But efficiency is a financial metric as well. In this use case, we’ll see how having the right financial benchmarks in place allows you to compare your costs to industry averages. This shows sellers how competitive their campaign is while informing buyers about over or under-priced campaigns.
This is the role PortMA’s Industry Reports and BI Experiential Dashboards play. Both Dashboards and Reports have the same information around average costs per day of activation with segments available by product category, venue, and market.

In this example for the wine sampling category, we see a set of ranges defined by the number of consumers engaged on average per day. To the right, you see the average all-in budget per day of activation at each rate of engagement. And on the far right, you can see the number of event days these benchmarks are based on. In fact, PortMA’s database of wine activation is well over 24,000 event days strong.
01:16 How to Know if Your Experiential Activation is Too Expensive
And we can use this information to compare different programs. Take, for example, Program A and B. Program A is proposing 490 days of activation, during which they’ll distribute 20,000 samples for a budget of 310,000 dollars. Program B is proposing 15,000 days of activation, during which they’ll distribute 750,000 samples for a budget of 6.4 million dollars.
Let’s look more closely at Program A and see what the Benchmarks tell us about this program. Plan A is spending 633 dollars to reach 41 consumers per day. We can see that math here; 310,000 dollars divided by 490 days equals 633 dollars per day and fits right about here in the upper end of the benchmarking range. When we trace that spending level back to the associated benchmark engagements per day, the benchmarks indicate it would be fair to expect someone spending at this level to be engaging between 52 and 59 people per day.
02:15 Using Macro Engagement Metrics per Day Estimates to Evaluate Budgeting for Experiential Marketing Budgeting
We can take the low end of that range and see that 52.2 people sampled per day times 490 days equals 25,578 engagements. The benchmarks tell us that Plan A should be at least 26,000 samples total at that budget, if not 29,000, based on the estimate at the high end of the range. If this was a program you were proposing or considering, you might be well served to push back a little and see if there are opportunities to reduce the budget.
However, Plan B is a different story (even though it doesn’t look like it at first). Plan B is targeting 50 consumers per day on a budget of 427 dollars. We can see that we divide the 6.4M dollars by 15,000 event days to get the $427 per day. And this fits nicely in the below-average range of our cost per event day benchmarks. Tracing back to the expected level of daily sampling engagements, we see something in the 20 to 52 range is fair to expect. Plan B is proposing an average of 50 consumers sampled per event day. This appears beautifully at the high end of the range. Not outrageous but high performing nonetheless.
It’s spot-on, and if the resources are available, Plan B might be the best option for the brand. And this is the power of PortMA’s benchmarking reports or dashboards. You have unrivaled insights into 10s of thousands of activation days to know how you compare or if the program you’re considering is reasonable and even possible.