How Experiential Benchmarks Drive Higher Performing Experiential Marketing
Using Experiential Impact Benchmarks to Develop Stronger Activation Strategies and Better Venue Selection
![]() Video Length: 2 minutes 53 seconds
Video Length: 2 minutes 53 seconds
Firstly, marketing is about change. And in this use case, we’re going to look at how you can use experiential impact benchmarks to predict where, how, when, and by how much your campaign will change consumer intention to buy the product you’re promoting.
Table of contents

Calculate and Value Five Types of Experiential Impressions
This tool has been designed to assist with the value calculation for five impression types: Mobile Impressions, Event Impressions, Viral Word-of-Mouth, Organic Media, and Paid Media.
Frequently Asked Questions
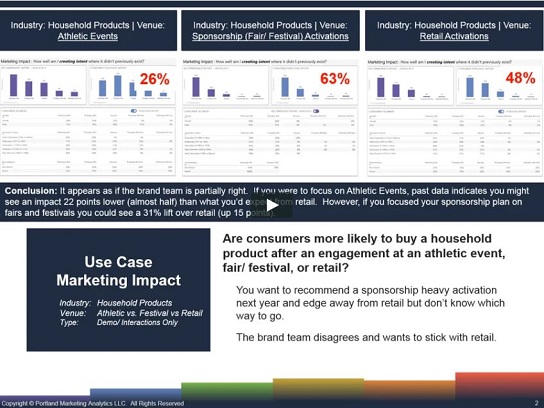
For example, are consumers more likely to buy a household product after an engagement at an athletic event, fair/ festival, or retail activation? Let’s say you want to recommend a sponsorship heavy activation next year and edge away from retail, but you don’t know which way to go; should you suggest athletic events or fair/ festival activations. Maybe the brand team disagrees and wants to stick with retail.
PortMA’s Experiential Marketing Benchmarks database has 1,868 exit interviews from consumers who engaged with a footprint promoting a household product at an athletics event. Here we see that the typical purchase intent for household products being promoted at athletic events was 26%. Or just over one-fourth of consumers reported that they planned to buy the product after their experiential engagement for this industry and at this venue type.
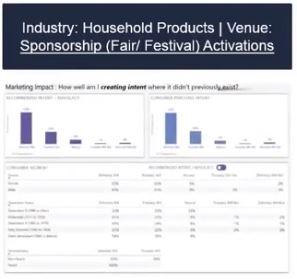
PortMA’s Experiential Marketing Benchmarks database has 721 exit interviews from consumers who engaged with a footprint promoting a household product at fair/ festival activations. These sponsorship events tend to post a purchase intent more than twice as high at 63%.
PortMA’s Experiential Marketing Benchmarks database has 9,449 exit interviews from consumers who engaged with a footprint promoting a household product at retail activations. Purchase intent at retail for this category trended at 48%.
Video Transcripts – Experiential Impact Benchmarks
Estimated reading time: 6 minutes
Above all, marketing is about change. And in this use case, we’re going to look at how you can use experiential benchmarks to predict where, how, when, and by how much your campaign will change consumer intention to buy the product you’re promoting.
00:32 Venue Selection Scenario
For example, are consumers more likely to buy a household product after an engagement at an athletic event, fair/ festival, or retail activation? Let’s say you want to recommend a sponsorship heavy activation next year and edge away from retail, but you don’t know which way to go; should you suggest athletic events or fair/ festival activations. On the other hand, maybe the brand team disagrees and wants to stick with retail.
As a result, this is where PortMA’s benchmarks come in. Every syndicated report and experiential BI Dashboard deployment comes with detailed consumer impact benchmarks based on hundreds of thousands of onsite, in-person consumer exit interviews. Further, we can segment this data by venue type to see if consumers behave and respond differently by where the activation took place.
To do this, we’re going to segment the consumer impact data, in this case, “Purchase Intent,” by three-venue segments, “Athletic Events,” “Sponsorships,” and “Retail Activations” to see if we can answer the question of where consumers are most likely to buy after an activation.
01:29 Experiential Benchmarks – Athletic Events vs Fair/ Festivals vs Retail
Firstly, let’s start with Athletic Events. Here we see that the typical purchase intent for household products being promoted at athletic events was 26%. Moreover, just over one-fourth of consumers reported that they planned to buy the product after their experiential engagement for this industry and at this venue type. The same industry category at fair/ festival activations tended to post a purchase intent more than twice as high at 63%. And retail activations were strong but a little bit lower at 48% purchase intention.
01:58 Interpretation of Venue Benchmarks for Stronger Venue Selection
Finally, what can we conclude? What can we learn from the variability of purchase intent by venue within this product category? It appears as if the brand team is partially right. If you focused on athletic events, past data indicates you might see an impact 22 points lower (almost half) than what you’d expect from retail. However, if you focused your sponsorship plan on fairs and festivals, you could see a 31% lift over retail or up 15 points.
The path is clear. There is a clear argument for sponsorship activations next year to focus more on fairs and festivals and less on athletic events. Maybe test an athletic event or two but don’t put the majority of your spending in that bucket. There are better returns to be had for the brand elsewhere.