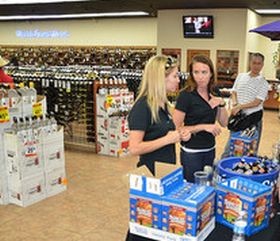
Last year we began measuring an off-premise experiential marketing program for a ready-to-serve (RTS) spirits brand. Activations occurred in only four markets, so the program was smaller in scope than what we typically measure. This made it behave more like a pilot than a full-scale experiential marketing program. We were able to uncover some insights around the event footprint that may not have been as obvious had the program been larger.
Program Overview
The brand teams conducted on-site surveys at various liquor stores in three US regions: New York-New Jersey (NY-NJ), Eastern Pennsylvania (PA), and North Florida (FL). We also had a plethora of field staff reporting data available to link with the survey results. There were differences in impact between the regions, which field staff reporting identified.
The program was centered on the “liquid-to-lips” experience, so we tracked the number of samples distributed in each market.
Another program objective was to generate on-site bottle sales following the liquid-to-lips experience. An easy metric to measure the success of that effort is on-site conversion or bottle sales as a percentage of samples distributed. There was a clear winner at the end of the program:
- NY-NJ: 20.1% (79 samples per event)
- PA: 12.0% (60 samples per event)
- FL: 9.2% (53 samples per event)
NY-NJ had the highest conversion by eight percentage points. In NY-NJ, for every five samples given out, one would lead to a purchase. Not only that, but NY-NJ was double the off-premise conversion benchmark (9.4%).
How to explain the difference in conversion.
Anecdotal evidence suggested that the higher conversion in NY-NJ might partly be attributed to good relationships with accounts, which leads to ideal event footprint locations on site. Brand team comments tended to be along these lines:
“Overall very popular…The consumers who did purchase enjoyed really learning everything about the brand and how the brand was created.”
On the other hand, PA and FL experienced some difficulty with footprint placement in the stores. Many comments from these regions were in the following context:
“My table placement, because of how the store was laid out, was awkward… kept causing traffic jams in the aisle.”
“BA was positioned in the middle of the store in a counter. There were two entrances, so it was hard to get consumers attention unless they were going to the register closest to our set up.”
So, event footprint placement at accounts in PA and FL were a challenge. Were there other factors that may have contributed to lower relative sales?
Target consumer reach (women 25+) was actually higher in PA (81%) and FL (72%) compared to NY-NJ (63%), and target consumers were significantly more likely to purchase the brand following the experience (78%) than any other consumers (62%). So, the brand teams in PA and FL were reaching consumers with whom the sampling experience should resonate most.
Not only that, but consumers in FL and PA already purchase RTS beverages (64% and 41%) more frequently than those in NY-NJ (18%), so the teams were engaging folks familiar with that brand category.
Conclusion – Challenging Event Footprint Placement
The survey results did not yield insight into the difference in conversion between the regions, so we drew from the qualitative evidence that the event footprint placement significantly impacted sales – not the event experience itself.
Photo Source: https://www.flickr.com/photos/37676753@N08/
