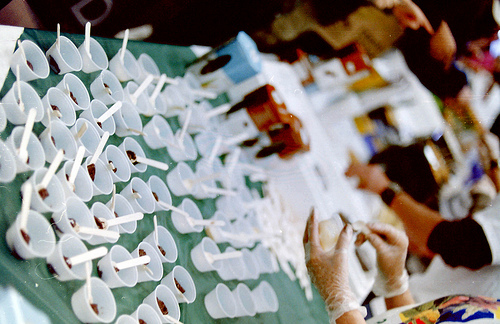
With reports flying off the fingers this week, my focus is turned towards sampling performance for our beverage programs.
One key area we monitor is the number of samples distributed, specifically the average number of samples distributed per event. By monitoring this metric we can project how the program, markets, or event types will perform over the course of the program. ( By the math: 50.0 average sample per event thus far, a total of 100 events planned we’re projecting 5,000 total samples.)
The projection by itself falls into the “nice to know” category. When we this data couple with program goals delivered by the client, it becomes a great way to watch sampling progress in the field. And not just watching, but being able to react and make adjustments ensuring that the right amount of samples get into the patrons’ hands.
We also work with clients to understand what may be impacting sampling in a certain market. For example, Kalamazoo has 62.7 samples per event on average, versus Timbuktu’s 88.3 samples per event. First we call out the lower performance of Kalamazoo. Then we talk with the client to understand that Kalamazoo had a weather issue (flood, hurricane, etc.) which resulted in some cancelled events and overall lower turn out. Finally, we discuss ways in which Kalamazoo is already planning to update their sampling and events to make sure they’re on target. Moving forward, we’ll monitor performance and document how these changes bring the team closer to their program goal.
This feedback loop allows us to clearly communicate program performance, highlight areas that need adjustment or monitoring, and work with clients to better understand what’s going in the market. It’s a great conversation all the way around.
Photo Source: http://www.flickr.com/photos/travisjuntara/6897542880/
