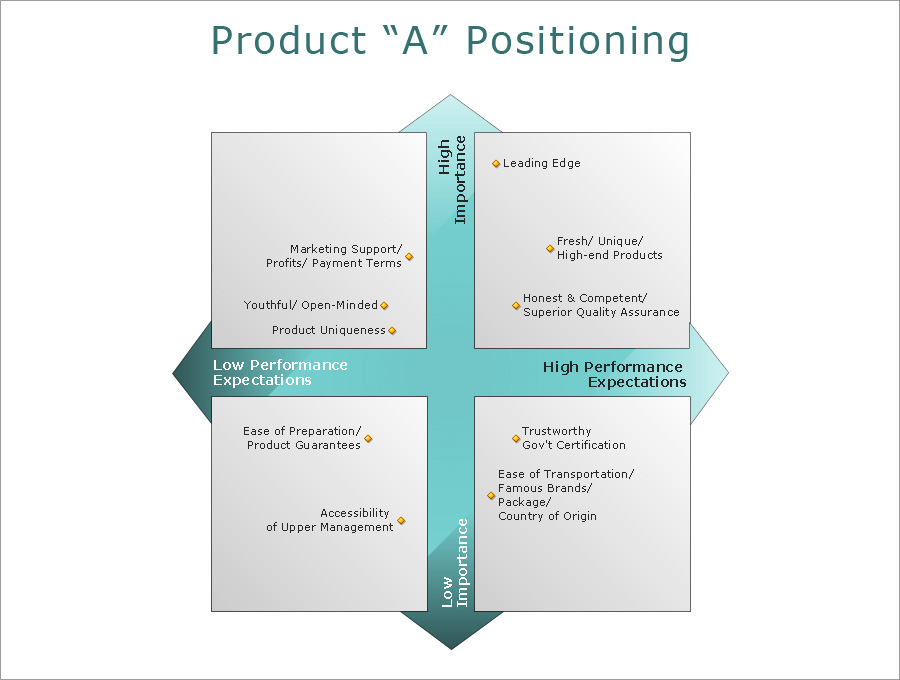
I always enjoy studying perceptual maps. At the same time, I am sometimes bothered by some of the data. There always seems to be one or two variables in the top right corner that clients love to see – that’s the quadrant where you’re hitting on what customers care about most. While those are almost always highlighted to give a good pat on the back to everyone in the room, the question arises, “Are those the most important variables on the map?”
These variables could be the least significant in terms of customers’ needs. My favorite example is one that comes from the medical industry where, if you look at an importance-performance perceptual map for implanted devices (think pacemakers), you may see “low morbidity rate” in the upper right-hand quadrant.
But all that shows is that, when considering pacemakers, doctors want one that won’t kill their patients and that, generally, the ones they’re buying aren’t killing them. I’m sure you’re happy to hear that.
While it’s always a nice idea to deliver an “atta-boy” during a presentation, distinguishing between critical factors and factors that make clients stand out from competitors by those factors that are simply expected is essential to delivering useful data. The example is not limited to the medical field. This problem can be found in the interpretation of data in every industry. Game designers need to make games that are “entertaining.” Automotive manufacturers want to make cars that are “reliable.” Clothing designers need to make clothes that are “comfortable.”
How to differentiate between “expected” and “distinguishing” factors
It is important to cast a wide net when designing surveys to make sure you’re getting all the information you need. On the other hand, if you are tracking too many attributes, the data can become confusing.
Ask yourself:
- What data is essential to my product?
- What should make my product compelling?
- Are customers seeing what I want them to see?
- Have we been missing customer expectations?
Don’t be excited just because something shows up in the upper right-hand quadrant. Understand that something is going to be there. The important thing to understand is why it is there . . . or why something you expected to be there is not.
Photo Source: http://www.conceptdraw.com/samples/marketing-sale-diagrams-matrices