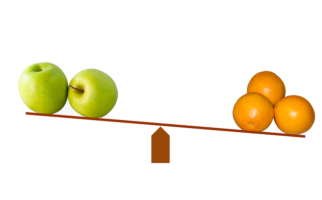
Is there such a thing as too much data? Generally speaking, no. The more results you have, the better, right? In an ideal world, we would be doing a census instead of a sampling survey. Wouldn’t you love to know what everyone is thinking? If you did, you would never make an incorrect business decision again. But, with that being said, there are some situations where having too much data can be a problem.
The Problem:
Having too much data from one market can throw off your overall averages pretty severely. What happens when you have 800 results from California, and only 50 from New York. California has a 100% purchase intent, and New York has a 50% purchase intent. You aren’t really being honest if you say on average, 97% of consumers are likely to purchase. It’s mathematically accurate, but your base for making that assumption pretty heavily hints that your product will not do well in New York. So how would you explain this in 6 months when California is doing great, but new York is a profit drain?
One Solution:
There are a few things you can do to deal with this. Cautious reporting is a good first step, compare across your markets and demographics consistently to look for outliers. Although you are inspecting the data cautiously it is still important to look across all your major segments. Gender, age, market, and event experience can all have a massive influence on people’s perception of the product. By ensuring you don’t have any outliers across these metrics, you can be more confident when speaking to the overall data summary.
If you do find such a difference, you can address it by weighting your data. There are many articles on exactly how to weight your data (Like this), but what’s important is that you weight across the variables that appear to be having the biggest disparity in purchase intent. This will ensure that your overall numbers are the best possible reflection of the overall populace.
Another Approach:
In cases like the New York and California results above, there is another approach you can take. Those types of differences in results would make you use some rather extreme weights (>5), which many people are uncomfortable doing to a data set, as high weights tend to obfuscate your base results. As such, you can remove some of the results from the larger data sample, to bring it more in line with the smaller data set. I would only recommend this when absolutely necessary, and it is incredibly important that the results you remove be random. I cannot stress enough how important the randomness is. If you just cut out a section of your results, you’ll likely end up skewing them in some way you didn’t even realize.
Additionally, in order to do this your sample set has to be sufficiently large so that you can remove results randomly and not expect to influence other factors (i.e. the gender breakout should remain roughly the same after removing results). Additionally, I would still include all of the results when reporting on that market specifically, as the additional results have no impact on other numbers, and you ensure a representative sample by using the largest base possible.
The Conclusion:
Dealing with lopsided data sets is a hassle, and I would recommend you proceed with extreme caution, and always keep your client informed of what decisions you are making with regards to the data. There is nothing worse than wrapping up a report, and having to explain what weighting is to a client, only to have them want the report unweighted, effectively undoing all of your hard work.
