
Data is now an integral part of making sure you stay on top of how your business is performing. Despite being a fairly new area of study in the industry, the benefits of collecting and understanding data has skyrocketed. It is a practical requirement for any business leader looking to get ahead of the game.
In this article, we go through an overview of the different data types and see how each one can help you make better decisions.
Estimated reading time: 3 minutes
Key Data Types: Quantitative and Qualitative
Quantitative Data
Quantitative data is likely the type of data you’re most familiar with. Often this type of data is presented as hard numbers, which can be added, subtracted, averaged, and even ratioed. Some examples of quantitative data that is normally collected are how many visitors a store gets per month or average revenue year-on-year.
The most common type of data you’ll likely encounter would be discrete data. This is data that is representative of a set of observations in itself.
Compare this with continuous data. This is a type of data that can be further subdivided or converted into other units and still be representative of a specific observation.
If you’re studying how many workers there are in a company, that would be discrete data. You can’t further convert that number into smaller increments or another metric and still be representative of the original observation.
But if you’re studying the average square footage of a factory, you can definitely view that data point as continuous data as you can likely place the measurement at a scale and still understand the data.
(You can listen to the full episode of the podcast below.)
Qualitative Data
Qualitative data is the other side of the coin for data analytics. While quantitative data focused on measurements and exact metrics, qualitative data looks at the frequency of traits, characteristics, as well as common observations that aren’t normally measurable.
While it may seem abstract, this can be incredibly insightful to managers and marketers. It can give a better perspective into the minds of your consumers.
Secondary Data
One of the easiest ways to gain qualitative data is to look for sources in which consumers regularly voice opinions or comments about specific things. This can include reviews for products, queries on message boards, or even general musings on Twitter and other social media platforms.
Even if the original purpose of these messages was not related to a specific business question, they can still be extremely informative and provide some context on certain behaviors.
Primary Data
Where there is secondary data, there’s primary data. This is data that you source yourself from a group of respondents. This also means having to go out onto the field and gather information. You will use a specific set of questions to achieve an insight goal.
There are two main ways to go about this: in-depth interviews and focus groups. While the two methods share some similarities, there remain some key differences in how they work.
In Part Two, we look at how best to execute and collect primary data. We also offer some best practices regarding data logistics.
Download the Free Spreadsheet Tool
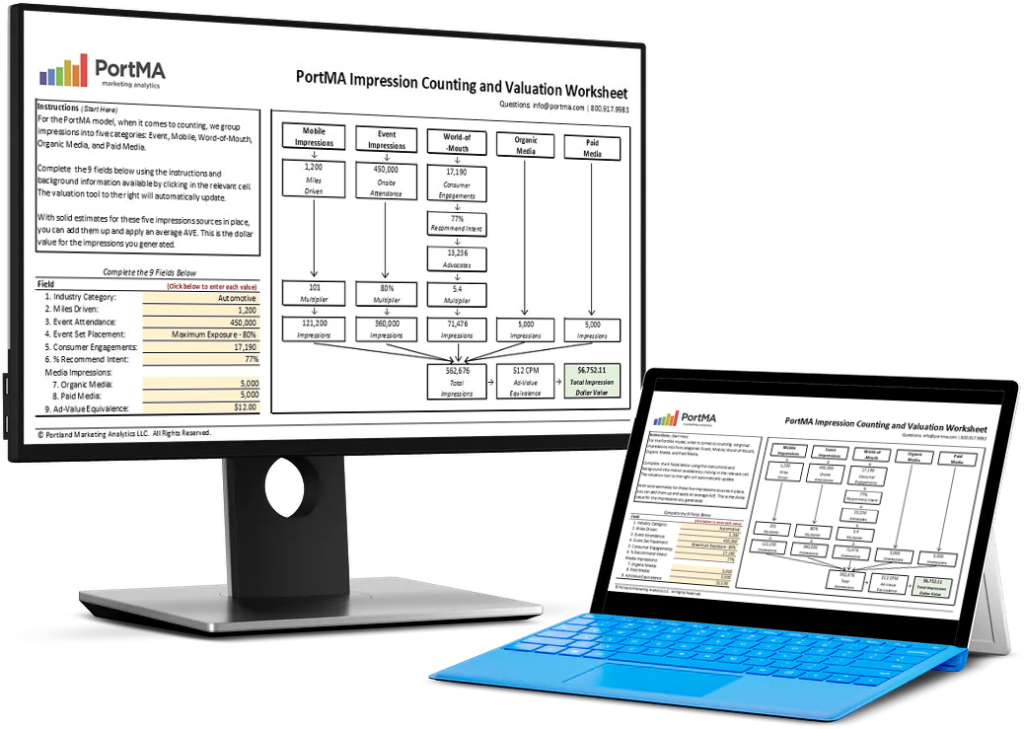
CALCULATE THE DOLLAR VALUE OF EVENT IMPRESSIONS
PortMA Impression Counting and Valuation Worksheet
Download this spreadsheet and complete the fields for your campaign to get a clear count of your activation impressions translated into a Dollar Value of Marketing
Impression Spreadsheet