
When you’re analyzing experiential marketing field data, it’s common to break down the information you receive into different metrics to gain the best possible insights. Dividing different categories of information even further, by splitting data into day-to-day metrics becomes even more useful.
Day-to-day metrics help you identify best practices and learn from your past performance. They are also an excellent indicator of potential field staff issues and solutions for them.
Estimated reading time: 3 minutes
What Data Breakdowns Reveal
There are countless different ways to break down experiential marketing data. Depending on the answers you need and the client’s needs, different metrics can be more useful than others. Some of the most common metrics include:
- Number of days of activation
- Average number of activations per day
- Activations per market
- Event attendance
- Consumer interactions
- Etc.
There are no right or wrong questions to ask. It all depends on what you are trying to achieve with your data analysis. In many cases, experiential marketers will be looking to identify best practices they can repeat to help increase event impressions and drive ROI.
(You can listen to the full episode of the podcast below.)
Example: Breakdown by Market
To illustrate the power of day-to-day analytics, I’m going to use an example of a breakdown by market. For this example, let’s assume you’re running wine-tasting events in five different states. So you’re breaking down your data by state to find that you are activating for an average of three hours per day.
Breaking numbers down by state reveals a little variation but not too much. For example, with activation hours of 3.1 in New York and 3.0 in North Carolina, you can see that all markets are close to the average. That’s great data validation because it helps you see the consistency. Based on that, you can extend your analysis into other metrics.
As a second metric, we’ll add interactions. Dividing all interactions by activation hours results in an average of 48 activations per day. Now, we can start looking at the individual states to see if there is variety. Let’s say North Carolina is leading the field with over 71 interactions whereas New York is below average with 42, and North Dakota is dragging at 28.
Seeing the discrepancies, you can start asking more pertinent questions: how good is the average of 48? And what’s happening in New York or North Dakota? Am I seeing normal variations or is one region performing better than the others for a reason?
Identifying Best Practices
All the places where you are scoring above average may represent best practices. That means these are the places where field staff manage to connect better with potential consumers. As a campaign manager, you want to understand these places better. What are the field staff doing differently?
Talking to field staff in exceptionally well-performing markets allows you to identify the best practices that need to be spread across the board to lift up everybody’s performance. At the same time, you need to watch underperforming markets just as closely. Field staff there need help and support before it’s too late for the campaign.
With the benefit of detailed breakdowns, it’s easier to identify potential common field staff performance issues.
Download the Free Spreadsheet Tool
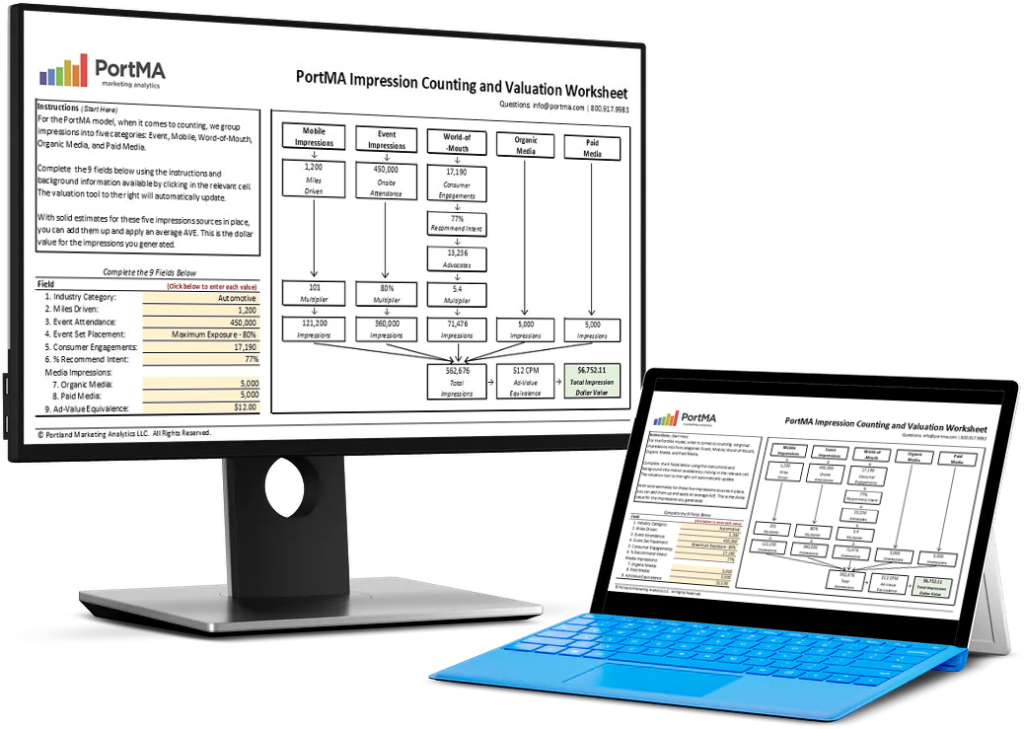
CALCULATE THE DOLLAR VALUE OF EVENT IMPRESSIONS
PortMA Impression Counting and Valuation Worksheet
Download this spreadsheet and complete the fields for your campaign to get a clear count of your activation impressions translated into a Dollar Value of Marketing
Impression Spreadsheet