Numbers are abstract. They are figments of our imagination. We use them to make sense of the universe. They are the basis for our method to tell the future. What fascinates me is the idea that, despite the theoretical concept, they follow scientific principles. Statistics and mathematics are really the rules of numbers.
Estimated reading time: 4 minutes
If something is completely up to our imagination – but at the same time has very strict rules – that seems incredibly compelling to me. There is unlimited power that comes from the understanding that data and numbers are completely under our control. Yet, the numbers move in these very predictable ways.
Defining the Measurement
I once saw the movie Pi. It was about a mathematician that went crazy trying to understand the phenomena of pi as a number. He talked about the fact that you can use it to tell the future. By accepting some basic principles, you can understand what’s going to happen in the future.
The first principle was the idea that anything in the known universe can be counted.
You simply need to define it in a way that’s measurable. For example, one would think that something as abstract as love could not possibly be measured. However, it can absolutely be measured. The way you measure love is by defining it in a way that can be observed and counted.
Let’s say, for our purposes here, that we define love as the number of seconds a couple holds hands as they walk through the park each morning. Any time I see that couple and they’re holding hands, I can count the number of seconds that they’re holding hands and record that as a rough estimate of love. As a starting point, let’s say that love is one possible measurement among what is very likely to be many others. Love, like anything else, can be quantified when you operationalize it.
(You can listen to the full podcast episode below.)
Chart the Future
The second point in that movie was the idea that anything that can be counted can also be graphed.
You simply need to add the element of time. First, We can take our same couple and use the number of seconds that they hold hands in the park as our rough measure of love in their relationship. Then, if we do that every day over a two-week period, we could start to chart the ebb and flow of their relationship over time.
We can look at how seconds change day-to-day, and maybe certain days of the week are different. They’re getting tired toward the end of the week and starting to ignore each other. Maybe, the beginning of the week is when things get a little more relaxed and they’re more likely to be holding hands. We can start to get a sense of how that relationship looks on paper by charting those seconds over time. By doing so, we can tell the future in a tangible way.
Tell with Data Patterns
The third point (that I thought was brilliant) was the idea that if you can graph it, you can predict it.
Any graph of human behavior is going to have patterns, and you simply need to look to see how that pattern is evolving and projected over time. Moreover, we know that human behavior is going to have predictable patterns because the alternative to predictability is chaos.
As humans, we’re social animals; we follow trends. It’s just a matter of identifying and operationalizing those patterns. We do that through charts and through looking at these phenomena over time.
Look to the Past
There are statistical techniques to help us understand the confidence of those trends. To help us understand, we look at those trends in a forward-looking manner; how accurate they may or may not be, based on historical averages. We know the best way to tell the future is to look to the past.
If every day Johnny came into the office at 8:32, and it was 8:15, and someone asked me, “What time is Johnny going to be coming into the office?” If I said 8:32, I would probably be right more often than not. We can understand the future by identifying the patterns of the past. That graph of this couple holding hands through the park, charted over time, can start to give us a sense of what their future relationship might be.
We understand the future by identifying the patterns of the past.
There are intervening variables, things that change. But, within the microcosm that we’re working with here, that line of thinking allows us to start to deconstruct how to predict the future. There’s something fascinating about the fact that it’s based on data (numbers), and that the numbers follow these predictable rules. I find that to be an absolutely amazing resource from which to understand the world. As a trade that is marketable, and as a commercial application, the world of marketing has been where I found my home.
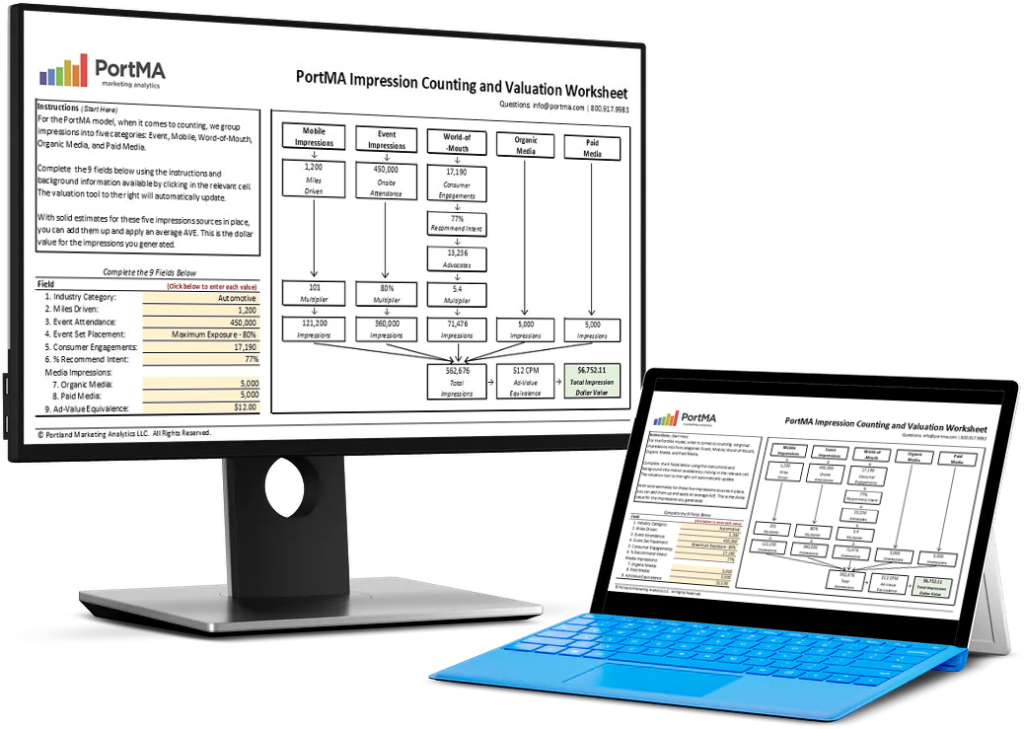
Download the Free Spreadsheet Tool
CALCULATE THE DOLLAR VALUE OF EVENT IMPRESSIONS
PortMA Impression Counting and Valuation Worksheet
Download this spreadsheet and complete the fields for your campaign to get a clear count of your activation impressions translated into a Dollar Value of Marketing
Impression Spreadsheet