
Data plays an integral role in every aspect of our lives. From science to marketing, engineering to education, data is the basis for better decision-making and more effective action in just about any domain you can imagine.
Before we can get into specific analysis techniques, you need to start framing data in a way that works for you. This begins with understanding the “idea” of data and how it is approached. In this article, we’ll cover how you can use and report data effectively to make smarter decisions in a wide range of situations.
Estimated reading time: 3 minutes
Using Data Effectively
Understanding which data to use and how to use it is critical to decision-making. There’s an abundance of data available to us and, with that, a slew of KPIs that can be used as diagnostics as part of a “ranking” system. However, the danger with this is that if you use the wrong diagnostic, or worse yet, try to diagnose based on ranking alone, you may make decisions that will ultimately hurt you.
Ranking diagnostics help you understand what’s happening and, consequently, what’s doing well. The first aspect you can focus on is causality, which refers to the relationship between data points. It links the cause of an effect to an outcome. To establish a connection between cause and effect, you need to establish three things:
- The cause happens before the effect.
- There has to be a reason two things are related.
- There has to be a mathematical relationship between the two.
(You can listen to the full episode of the podcast below.)
How to Decide What Data to Use
Once you’ve decided on the data set and the diagnostic, you need to decide what you’ll measure. This requires significant thought as it affects all future decisions. Simply put, data helps you make things easy. Every day, you’re aware of the information and if you identify a void, that’s where your data analysis should help fill in the blanks.
This naturally allows you to focus on these aspects:
-
- the information you need
- how you can analyze the data to get that information
- the metrics you would need for analysis
The Foundation of Better Decisions
Data is all around us. In fact, it’s the basis for just about every technology we interact with on a daily basis. Understanding how you can decide which data to use and how to use it is critical; not just to decision-makers, but also to the success of your organization. Therefore, the more you focus on the above. The more you can develop metrics (like event ROI) that you want to measure so you can gain insights to improve your business.
In the next post, we continue our discussion about Making Better Decisions with Data and tackle the importance of causality. We break down which aspects of user behavior are statistically significant, and how they can influence other aspects of your data.
Download the Free Spreadsheet Tool
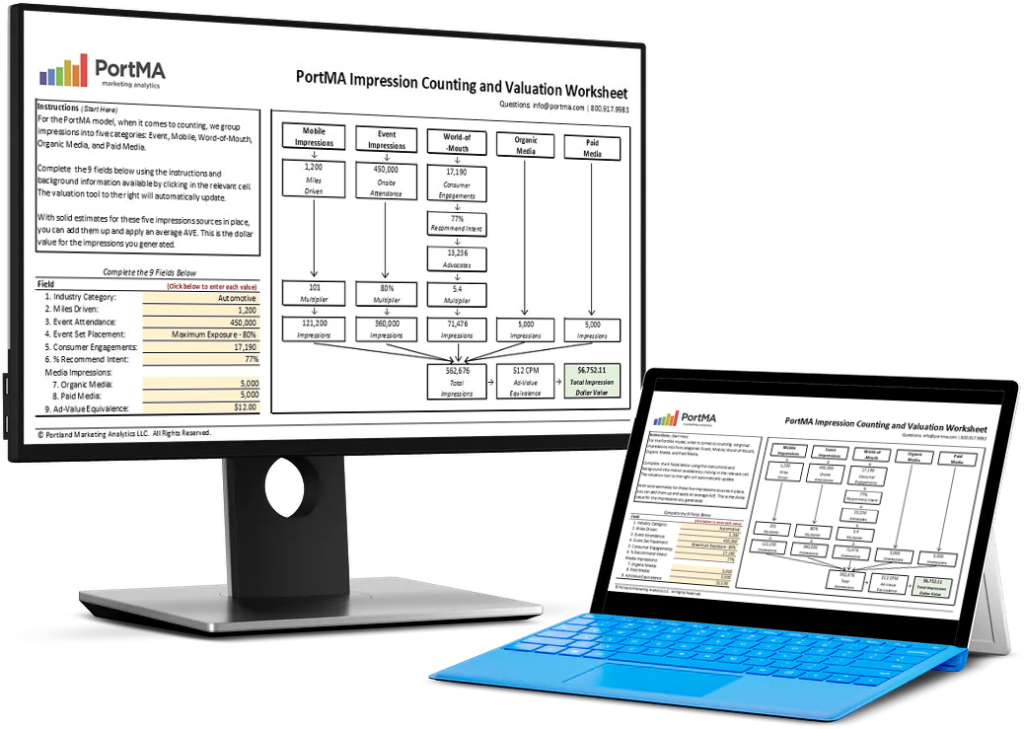
CALCULATE THE DOLLAR VALUE OF EVENT IMPRESSIONS
PortMA Impression Counting and Valuation Worksheet
Download this spreadsheet and complete the fields for your campaign to get a clear count of your activation impressions translated into a Dollar Value of Marketing
Impression Spreadsheet