
In the previous post, we discussed how qualitative data is about discovering and understanding what we do not know, while quantitative data was a way of gaining insights into the scope and magnitude of the information we find. In this post, we will look at the different ways to get access to quantitative data.
If you missed Part One, you can find it here.
Estimated reading time: 3 minutes
Secondary Quantitative Sources
This was the same thing that we talked about when it came to the qualitative side and secondary sources. Secondary data in general is a phrase used to reference data that was collected for some other purpose. But if we can get our hands on it, we can use it for our purposes.
Secondary data is fantastic because:
- It already exists and is thus faster to get access to.
- We can get our hands on it for a relatively low price or for free.
For example, a great source of the way the world works can be gotten from the US census. It can give us a lot of information about the dynamics of how we organize ourselves, what people do and where they go. Census is a great source of free information around that.
There’s also a huge industry of syndicated reports and secondary data that you can get from trusted websites like VPG Market Research. PortMA also provides syndicated resources. There are all kinds of different places to get syndicated data such as:
- World Bank
- Economic Forums
- NGOs
When you’re looking and getting ready to embark on a secondary data collection process it’s helpful to start with what I call an ‘information hit list’, which is thinking about what information you need and the specific format or the specific nature of the question you’re trying to answer.
(You can listen to the full episode of the podcast below.)
Primary Quantitative Sources
If you cannot find the data you want anywhere or it does not exist, you may need to use survey tools to collect fresh data from the primary source.
Intercept Survey
An intercept survey involves asking people questions, in person.
The survey should be brief, probably a minute long, which translates to around 4 to 6 questions. You could also use an app like the one we have at PortMA or a simple pencil and paper.
Try to make your questions:
- Give a sense of your history around what I’m trying to measure
- Be brief and specific
- Be consistent and standardized
Inconsistency in asking questions can blur variations where you would have otherwise seen several.
Email Invitations to Web Survey
We can send an email invitation to a web survey and we can ask people questions online and record their answers. And that’s an awesome process. That’s so cost-effective and so much better than the mail surveys we had in the late nineties. It’s a solid tool
Here’s how to get the best results:
- Personalize the email, it should seem human
- Make it clear in the subject that it’s a survey and where you got their information. A subject line that is really on target can get you a click-through rate of as high as 60%.
- Use incentives to boost click rates, such as a chance to win Amazon Gift Cards
- Delivery rates need to be around 95% or better
- Open rates and click-through rates are all north of 30%
- Keep the copy short and the value proposition clear
- Keep the survey short
We hope this gives you some kind of game plan or a roadmap to follow for data collection. From secondary data to surveys, we can help you get the right data with the right process.
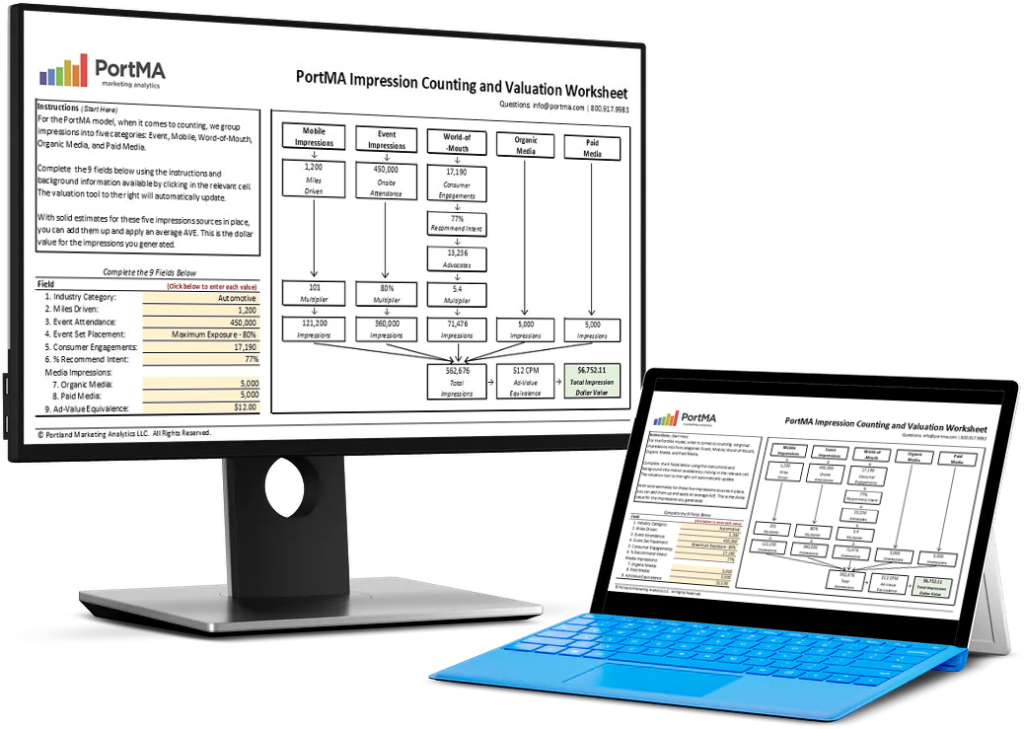
Download the Free Spreadsheet Tool
CALCULATE THE DOLLAR VALUE OF EVENT IMPRESSIONS
PortMA Impression Counting and Valuation Worksheet
Download this spreadsheet and complete the fields for your campaign to get a clear count of your activation impressions translated into a Dollar Value of Marketing
Impression Spreadsheet