
Hand on heart, do you always know why you are gathering the data you are collecting? Come on, be honest. Gathering all the data you can in the hope of making sense of it later is all too common, but it’s simply not the best approach. So, in this blog, we’re going to attempt to change your mindset when it comes to data collection. That’s what ranking and diagnostic reporting techniques are all about. Are you ready?
Estimated reading time: 3 minutes
Diagnostic Decisions
We want you to start with an end in mind. This doesn’t mean that you’re no longer open to making changes to an event you’re planning based on new insights gained from the data you’re gathering. Instead, what we’re proposing is that you start with a clear idea of the decisions you need to make with the help of the data you’re collecting.
Rather than collecting all the information, your data analysts can process, focus on what you really need to drive your business forward right now. Having a clear idea of what data is needed is critical.
Efficiency Ranking
Having clarified the questions you need answers to, you can see clearly which metrics will be useful and which you don’t need to worry about right now. By utilizing ranking and diagnostic reporting techniques, you’re identifying which aspects of your business you have control over and in which ways you can act on the insights gained from your data.
Let’s take a look at an example: imagine you’re managing a website. You want to know which pages draw users in and which have fast bounce rates with the goal to improve the pages that have the highest bounce rates.
To begin with, you can start by ranking the individual pages by the length of time users spend on them. This ranking component will make it obvious which pages are your high performers and which pages need reformatting or other adjustments.
With your ranking done, you can start looking at your best performers and diagnose why they are performing so well. This exercise helps you identify best practices which you can then apply to those pages that are performing below average.
(You can listen to the full episode of the podcast below.)
Choosing the Right Metrics
Choosing the right metrics means choosing those that are most meaningful in relation to your overall goal.
While ranking highlights “problem areas”, the diagnostic aspect helps you determine the key drivers towards the outcome you want. In other words, diagnostics help you identify what needs to be done.
There is no need to overcomplicate the process. Staying with our website example, we could look at page load times. We could measure mobile responsiveness or the ratio of text to images. The goal is to identify what is unique about the top performers compared to those at the bottom of the ranking.
Comparing and contrasting the data you gathered based on your chosen metrics will help you determine the actions you need to take. This will lead to more effective data reporting and better decision-making.
Does this all sound a bit abstract? Stay tuned for Part Two. We will take you through the process of ranking and diagnostic reporting and provide practical application.
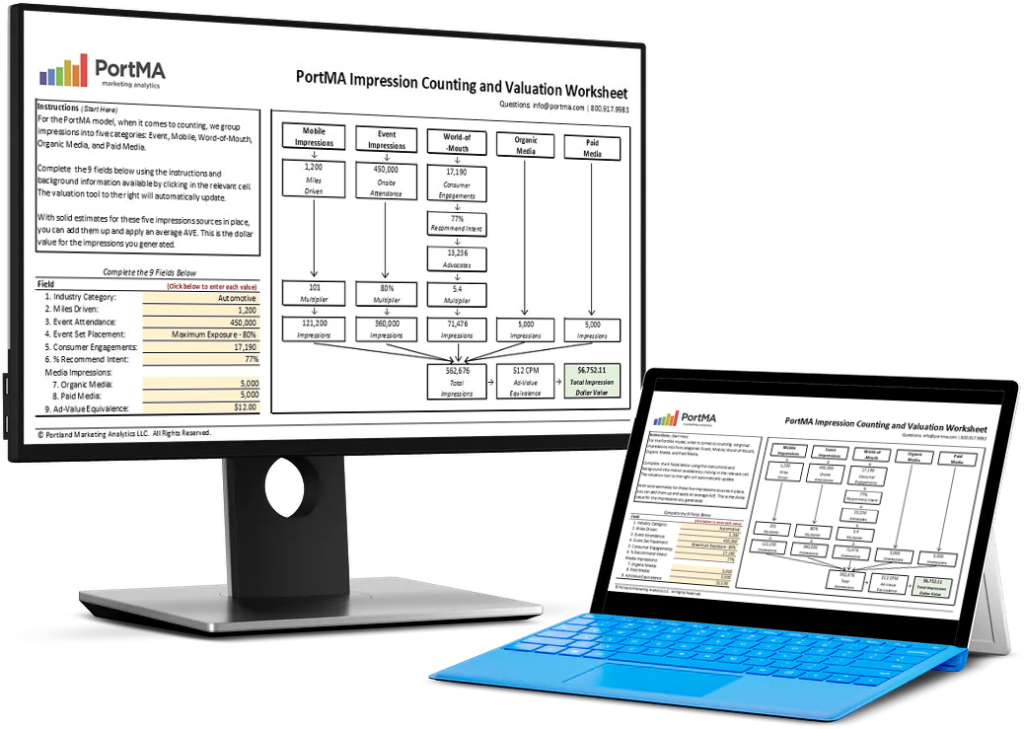
Download the Free Spreadsheet Tool
CALCULATE THE DOLLAR VALUE OF EVENT IMPRESSIONS
PortMA Impression Counting and Valuation Worksheet
Download this spreadsheet and complete the fields for your campaign to get a clear count of your activation impressions translated into a Dollar Value of Marketing
Impression Spreadsheet